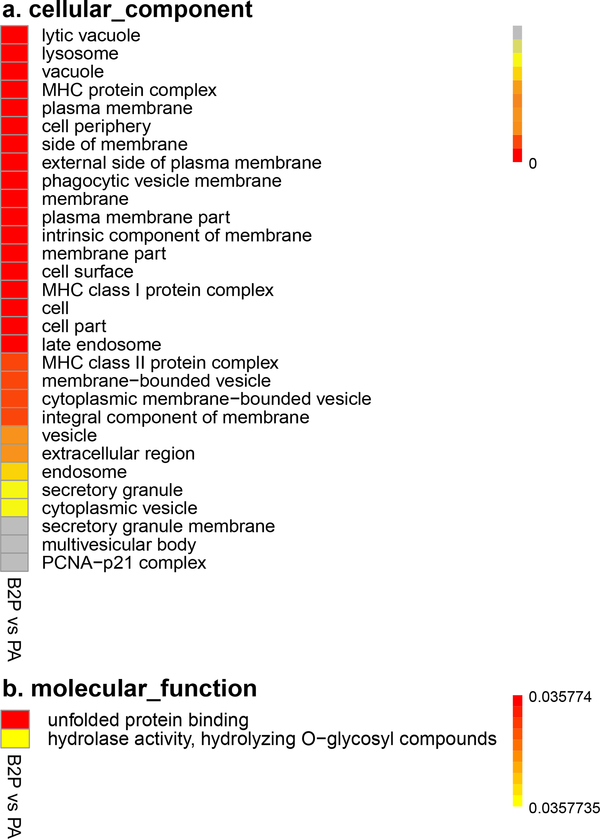
Figure 5:
Q-value distribution of GO terms enriched with differentially expressed genes in GO domains of cellular component and molecular function. Statistical significance is denoted by shades of color; a smaller q-value is signified by a darker color, and vice versa. PA, PS1/APP double transgenic mice. B2P, β2AR-KO PS1/APP-double transgenic mice.

