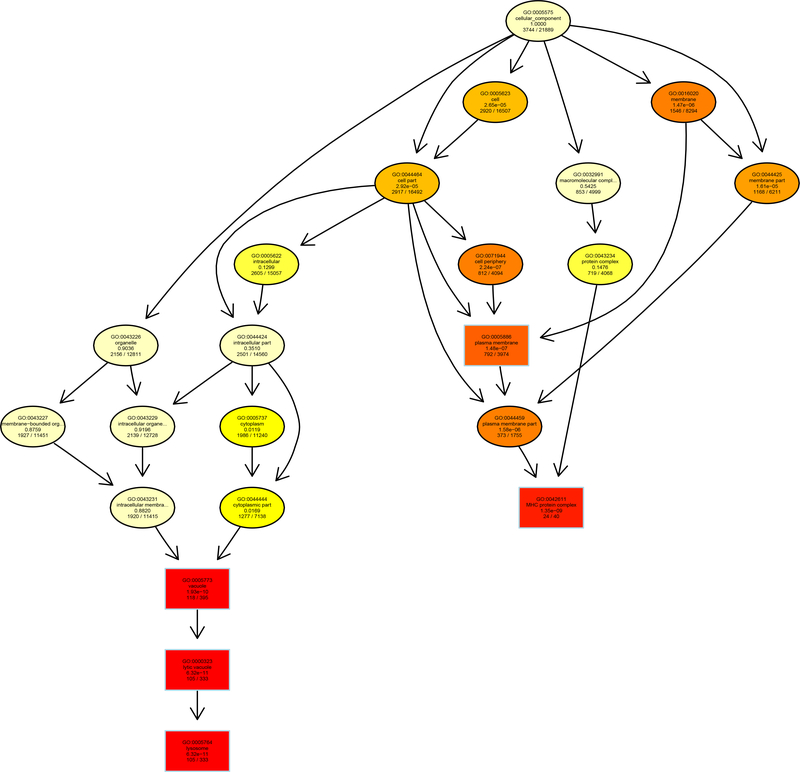
Figure 7:
DAG showing hierarchical relationships of GO terms highly enriched with differentially expressed genes in GO domain of cellular component. Five top-enriched GO terms denoted with rectangles are major nodes of the DAG, and relationships of interrelated GO terms were shown in the diagram. Each node in the DAG was shown with a unique GO access number, title, q-value and the proportion of enriched genes in the node. Statistical significance is denoted by shades of color; a smaller q-value is signified by a darker color, and vice versa.

