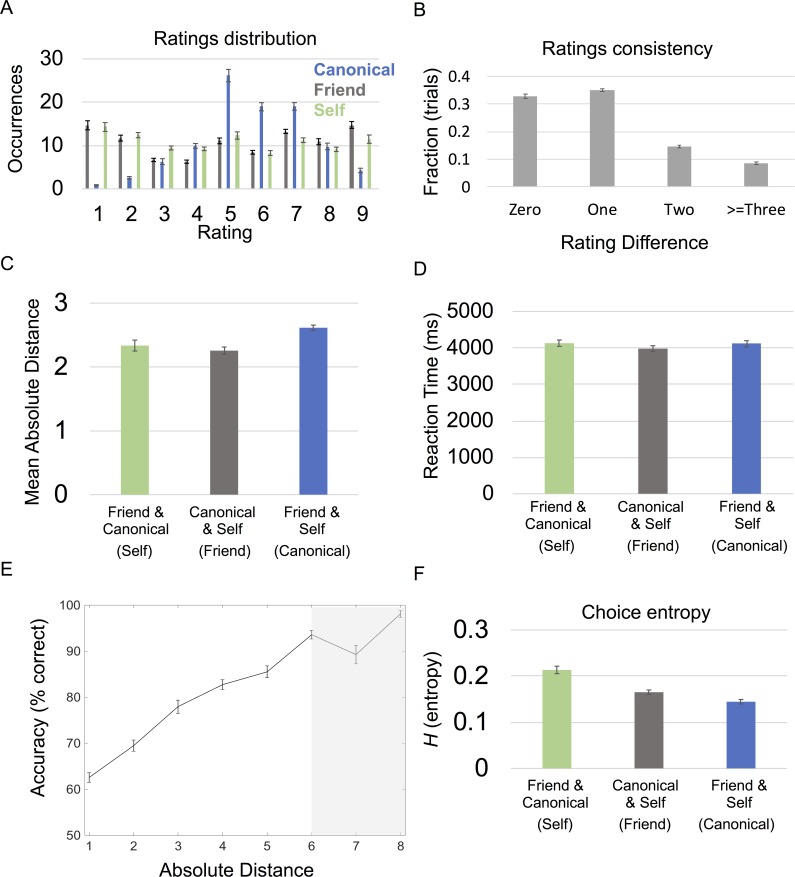
Fig 2. Behavioral results.
A. Mean ratings across subjects for each familiar individual and every scenario. Occurrences are out of the 100 total trials per condition. B. Rating consistency. Difference in ratings pre- and post-fMRI scanning for friend and canonical individuals C. Distribution of mean absolute distances by condition. Significant effect of condition for absolute distance between the two individuals’ ratings and the stranger’s (P = 0.001). Individuals being compared are listed in the key with the corresponding anchor/condition name listed in parentheses. D. Reaction time: Significant effect of condition for reaction time/decision speed (P = 0.022). Individuals being compared are listed below each bar with the corresponding anchor condition listed in parentheses. E. Absolute distances and performance. Significant relationship (P < 0.001) between accuracy and the absolute distance between strangers’ ratings and the nonanchor individuals for each trial. 50% represents chance level of accuracy. Seven and 8 on the x-axis are shaded in gray because 18/24 and 13/24 of subjects had trials with absolute distances of 7 and 8, respectively. F. Choice entropy: Significant effect of condition for choice entropy (P < 0.001). Individuals being compared listed below each bar, with corresponding anchor listed in parentheses. All error bars showing mean ± SEM. For absolute distance plots, the absolute value of each absolute distance was rounded to the closest integer and plotted from 1 to 8. See S1 Data for subject data. fMRI, functional magnetic resonance imaging.

