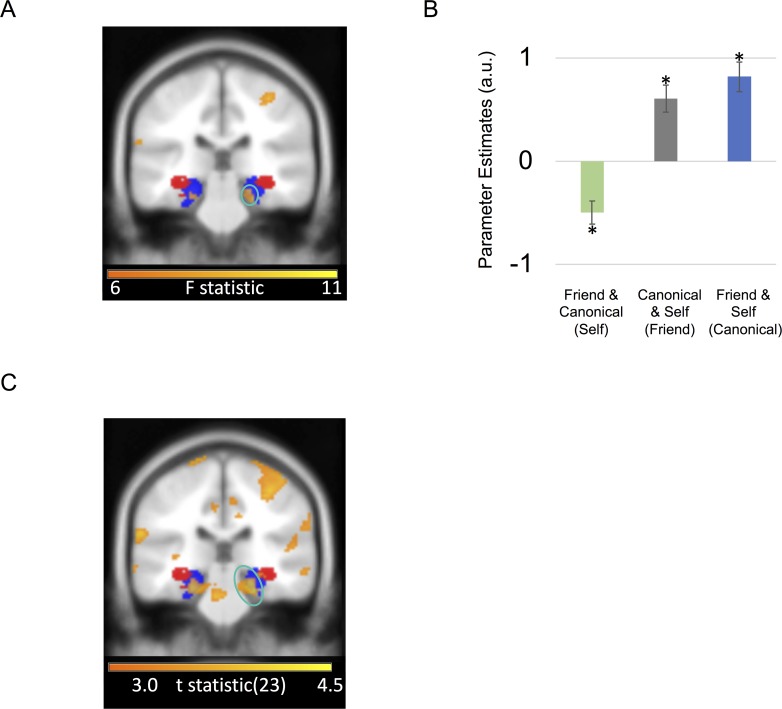
Fig 3. Entorhinal/Subicular choice discrimination effects.
A. Coronal image of right entorhinal/subicular region exhibiting an effect of choice discriminability/entropy by condition circled in turquoise. B. Effect size for a 10-mm sphere around right entorhinal/subicular region exhibiting effect of choice entropy by condition (mean ± SEM). Asterisk marks significance at P < 0.05. See S2 Data for subject data. C. Coronal image showing right entorhinal/subicular (circled in turquoise) correlation with choice entropy for friend and canonical anchor trials (i.e., choices involving self-comparisons) versus self anchor trials (i.e., trials comparing canonical versus friend ratings). Portion of left entorhinal/subicular region showing same effect is also visible. A positive effect size indicates a positive BOLD correlation with choice entropy (i.e., ambiguous choices), whereas a negative effect size indicates a negative BOLD correlation with choice entropy in the same comparison (i.e., straightforward choices). All highlighted regions survived FWE correction for multiple comparisons at P < 0.05 and are displayed at an uncorrected statistical threshold of P < 0.005 for display purposes. For visualization purposes, entorhinal/subicular (blue) and hippocampal body (red) probabilistic masks from the Jülich SPM Anatomy toolbox are presented [28]. BOLD, blood oxygen level-dependent; FWE, family-wise error; SPM, statistical parametric mapping.

