Fig 7.

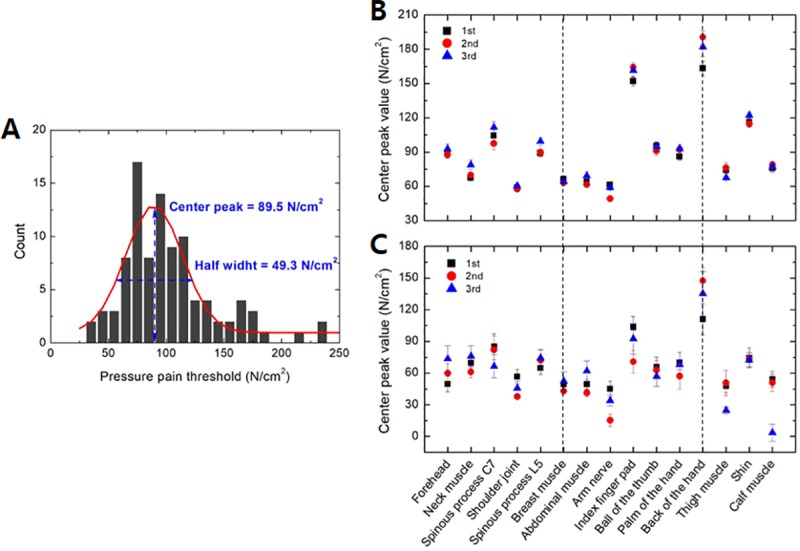
(A) Distribution of pressure pain threshold measured at the forehead. (B) Peak values and (C) half-width determined from the Gaussian fit of the thresholds of 100 participants.

(A) Distribution of pressure pain threshold measured at the forehead. (B) Peak values and (C) half-width determined from the Gaussian fit of the thresholds of 100 participants.