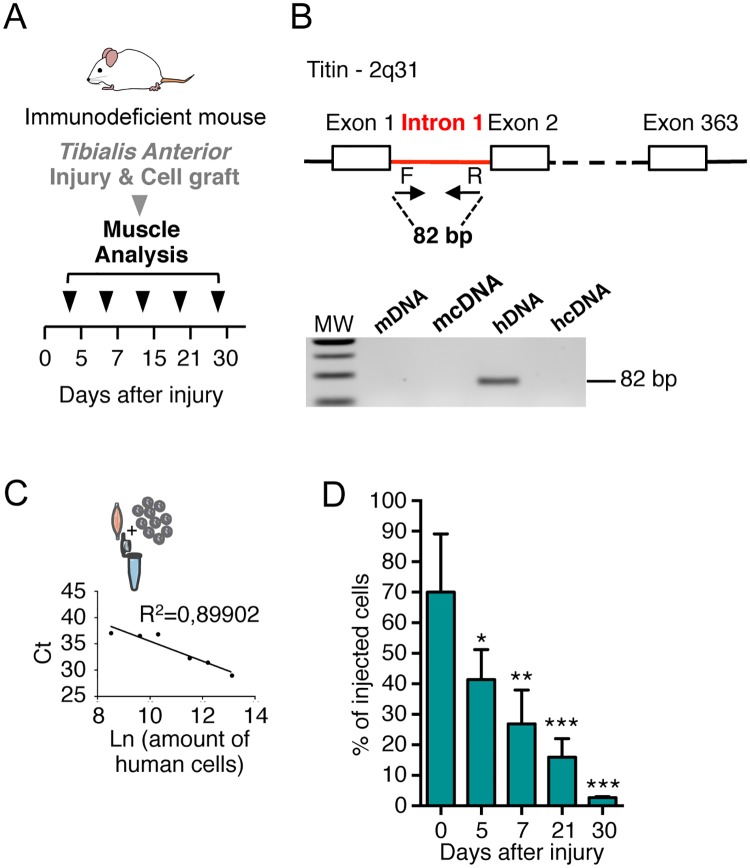
Fig 1. Quantification of human myoblasts in TA muscle by qPCR analysis.
(A) Experimental scheme of the kinetic of analysis of TA muscles injected with human myoblasts after freeze-injury. Human myoblasts were injected in a single injection site in the mid belly of the TA after that an injury was produced on the TA. TA muscles were dissected and frozen at different time points (0, 5, 7, 15, 21 or 30 days) after cell injection. (B) Schematic representation of primer (arrows) used to amplify human titin DNA by qPCR. Species specificity of titin primers is shown using mouse DNA/cDNA and human DNA/cDNA by qPCR and migration on agarose gel. (C) Representative standard curve obtained with DNA mouse TA muscles mixed and extracted with different amount of human cells. In the graph the number of cells is expressed as the Ln of the number of cells. In the ordinate axis the Ct (cycle threshold) representative of a qPCR run are reported. (D) Histograms showing the rapid quantification using qPCR analysis of TA analysed at 0, 5, 7, 21 and 30d after injection of human cells. The number of human myoblasts was calculated from the qPCR calibration curve. Results are means of the different TAs analysed ± SEM. The mean of each column is compared with the mean of the 0d column using an ordinary one-way ANOVA followed by Dunnett’s multiple comparisons test. *P < 0.05, **P < 0.01, ***P < 0.001.

