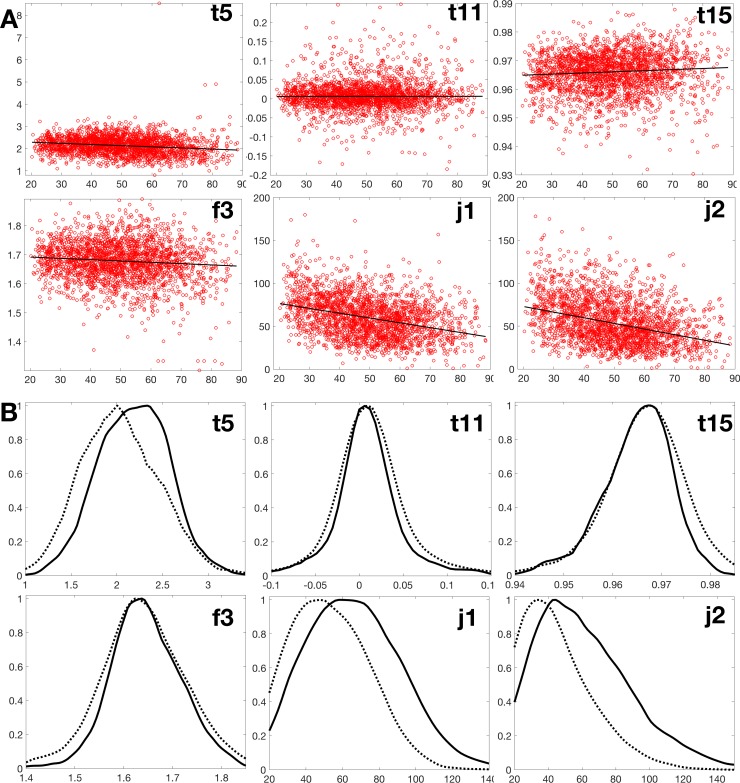
Fig 2. SardiNIA set.
(A) Distribution of six selected microvascular traits according to participants’ age. The ordinates are, for t5, total square curvature; j1 and j2, numbers of terminal points and bifurcations; t11, t15, and f3, dimensionless ratios. (B) Histograms of the same six traits, with numbers of individuals as ordinate and the y-axis measures of panel A on the abscissa (solid: <50 y.o., dashed: >50 y.o.).

