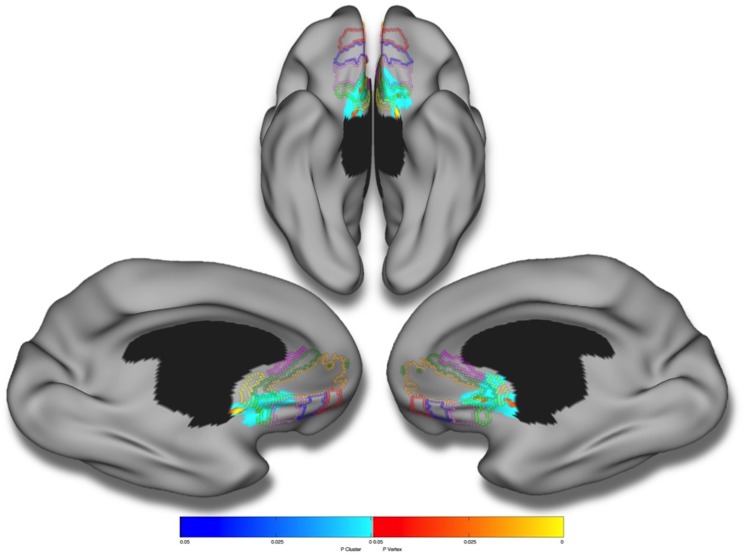
Fig 1. Amygdalar reactivity and cortical thickness.
Brain areas in which local cerebral cortical thickness is associated with the continuous measure of amygdalar activation (i.e., angry minus neutral face contrast) in a second-order (quadratic) model over the whole sample (n = 1753). Figure is shown at p ≤ 0.05, RFT corrected. Blue areas are significant at the cluster level and red color corresponds to areas significant at the vertex level. Controlled for age, total brain volume, sex, site, handedness, Performance IQ, Verbal IQ, SES and pubertal development. Colored borders correspond to the maximum symmetric probability map derived from the cytoarchtectonic studies of Mackey & Petrides (2014).

