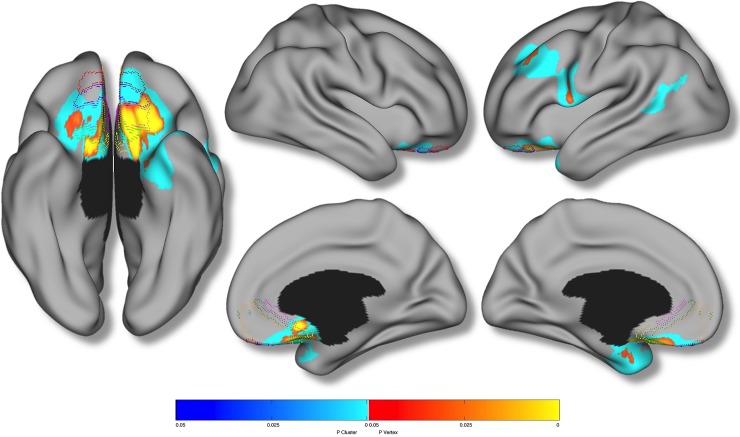
Fig 3. Results of “high reactive” group analysis.
Brain areas in which local cerebral cortical thickness was significantly reduced in the “high reactive” group (n = 90) relative to all other participants (n = 1663). Random field theory was used to correct for multiple comparisons over the entire cortical mantle. Figure is shown at p ≤ 0.05, RFT corrected. Blue areas are significant at the cluster level and red color corresponds to areas significant at the vertex level. Controlled for age, total brain volume, sex, site, handedness, Performance IQ, Verbal IQ, SES and pubertal development. Colored borders correspond to the maximum symmetric probability map derived from the cytoarchtectonic studies of Mackey & Petrides (2014).

