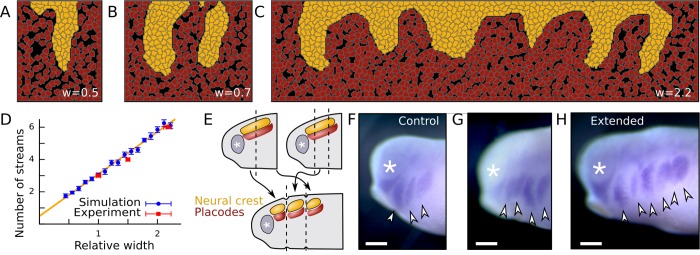
Fig 4. Number of streams is determined by the width of migratory region.
(A-C) Final cell configurations in simulations with varying widths (w) relative to the normal simulation width shown in Fig 3. (D) Number of streams (n) versus relative system width (w) in simulations and in vivo. Error bars: SEM; n = 20 simulations; n = 5 embryos; yellow line indicates linear fit: n(w) = 2.61*w+0.49. (E) Illustration of experiments for perturbing the width of the cranial NC migratory region. (F-H) NC streams revealed by ISH in control (F) and in extended (G, H) cranial NC regions. Lateral view; *, eye; arrowheads, streams; scalebars: 300μm.

