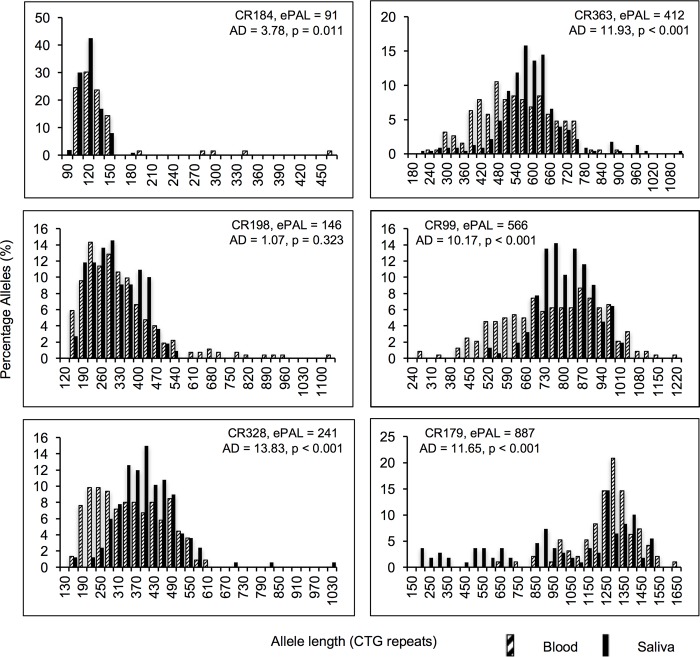
Fig 3. Representative histograms showing the allele distributions in two tissue sources of six DM1 patients.
The header indicates the progenitor allele length estimated in blood (ePAL) for each patient and the probability value (p) of equal distributions in both sample sources, calculated using the t-statistic of Anderson-Darling (AD). Patients with blood ePAL < 150 CTG repeats show similar allele distributions, while non-congenital DM1 patients with an ePAL > 150 CTG repeats showed a higher degree of instability in blood. Congenital cases showed higher levels of instability in saliva than in blood (bottom right).

