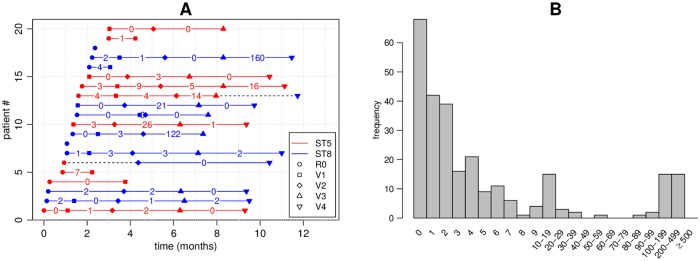
Fig 1. Illustration of a subset of the data used in the study.
Each row in panel A corresponds to one patient. Only the first 20 patients are shown. R0 is the initial hospital visit and V1, V2, etc. are the subsequent visits. Red colour refers to ST5 and blue to ST8. The numbers show the number of mutations di between consecutive isolates. The samples were obtained from nares swabs and represent single colonies. Dashed black colour highlights cases where the ST changed from ST 5 to ST 8. Panel B shows the frequencies of observed distances di between consecutive samples. These distances were used for model fitting.

