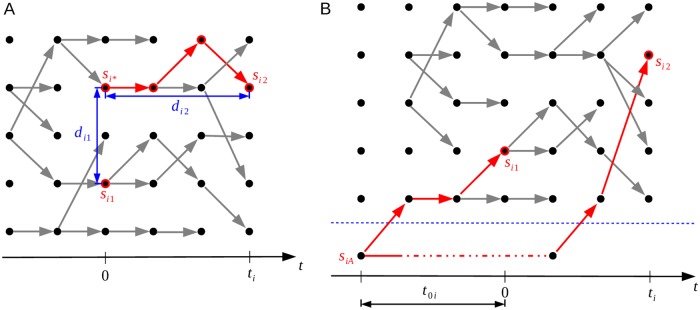
Fig 3. Outline of the ‘same strain’ and ‘different strain’ models.
Model pD on the left (panel A) represents the situation where the genomes denoted by si1 and si2 are of the same strain. Model pS on the right (panel B) shows the case where these genomes are of different strains. Time flows from left to right in the figures, the dots represent individual genomes, and the edges parent-offspring relationships.

