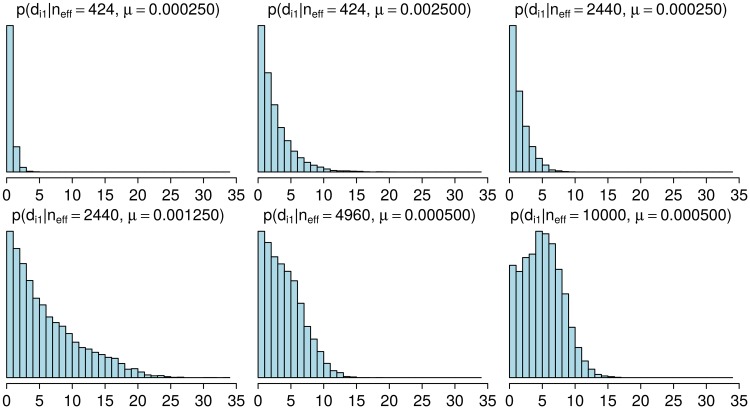
Fig 4. Distributions of pairwise distances for populations simulated with different parameters.
The histograms show the estimated probability mass functions with selected parameter vectors (neff, μ). Increasing μ and/or neff tends to increase the distances. Each histogram represent variability in a simulated population at a single time point 6,000 generations after the beginning of the simulation.

