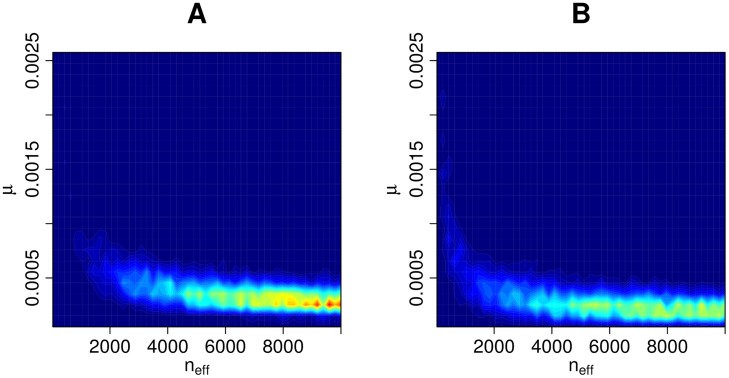
Fig 5. ABC posterior distribution for (neff, μ).
The ABC posterior distribution i.e. the updated prior for parameters (neff, μ), the effective population size and mutation rate, given data D0. Panel A shows the result with the full data and panel B the corresponding result with only a subset of the data (see text for details).

