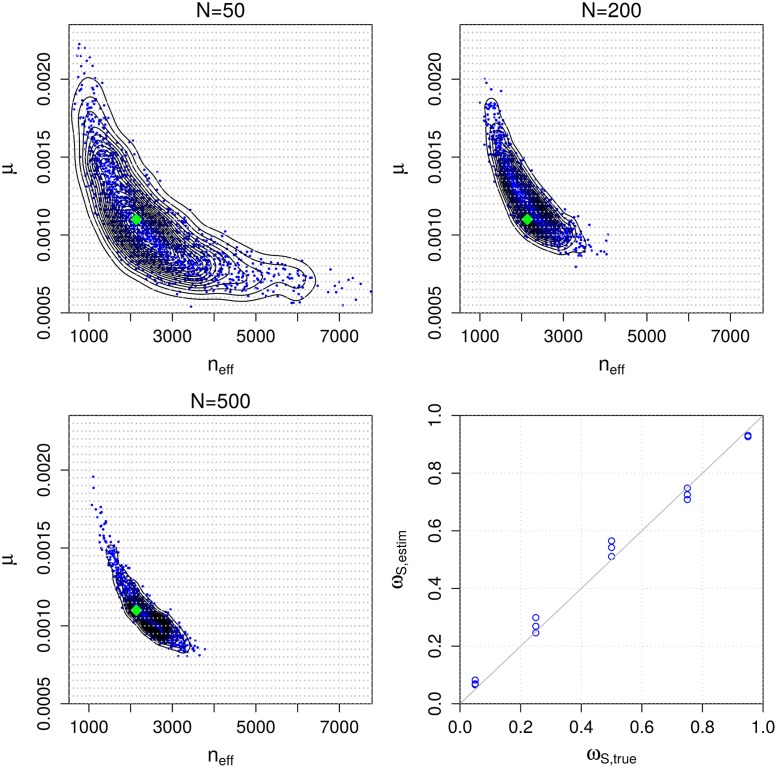
Fig 6. Accuracy and consistency with synthetic data.
The first three panels show the estimated posterior distributions for parameters (neff, μ) of the mixture model using simulated data of different sizes N. The green diamond shows the true value used to generate the simulated data and the light grey dots denote the grid point locations needed for numerical computations. The bottom right panel shows the estimated vs. the true ωS parameter in a set of additional simulation experiments.

