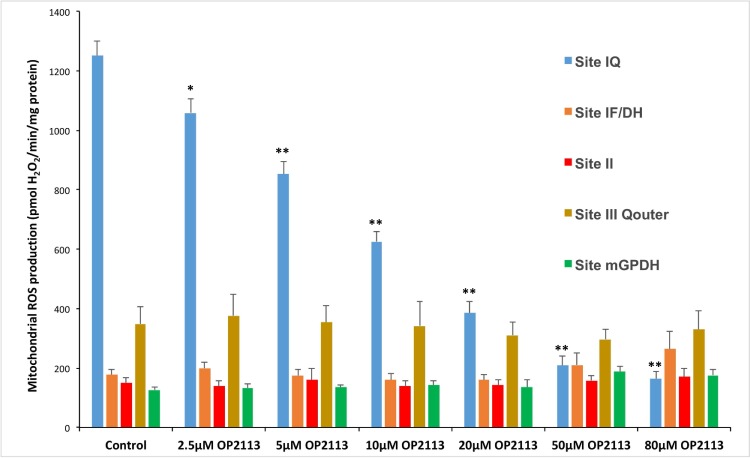
Fig 4. Specific effects of OP2113 on ROS/H2O2 production at different sites in isolated rat heart mitochondria.
The rates of ROS/H2O2 production were measured under conditions specifically designed by MD brand's group for the identification of the different mitochondrial ROS production sites [21, 22, 24, 38](see Methods section for details). The effects of increasing concentrations of OP2113 (from 2.5 to 80 μM) were tested for each condition of ROS/H2O2 production. Data are based on 3 to 5 independent experiments, each performed in duplicate or triplicate. *P < 0.01, **P < 0.005 versus control group.

