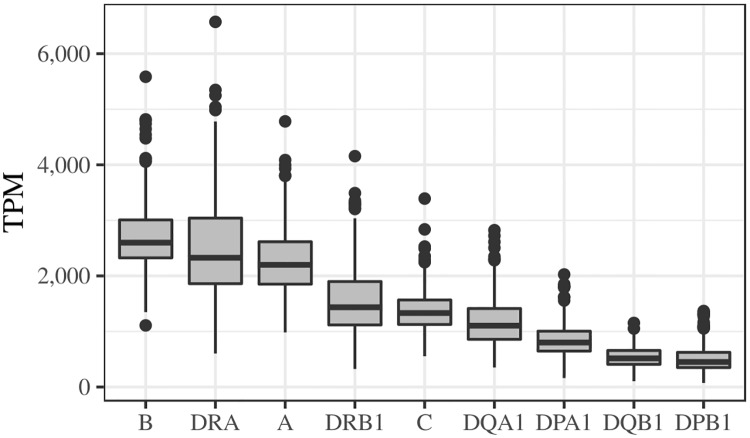
Fig 3. Gene-level expression of classical HLA genes in 358 European individuals from GEUVADIS [24].
Expression was estimated with the HLApers pipeline. Horizontal lines inside each box represent the median. The lower and upper hinges correspond to the first and third quartiles respectively. The whisker lines extend from the hinges to the largest value no further than ±1.5 × IQR from the hinge (where IQR is the inter-quartile range, or distance between the first and third quartiles). Data beyond the end of the whiskers (“outliers”) are plotted individually. TPM: Transcripts per Million.

