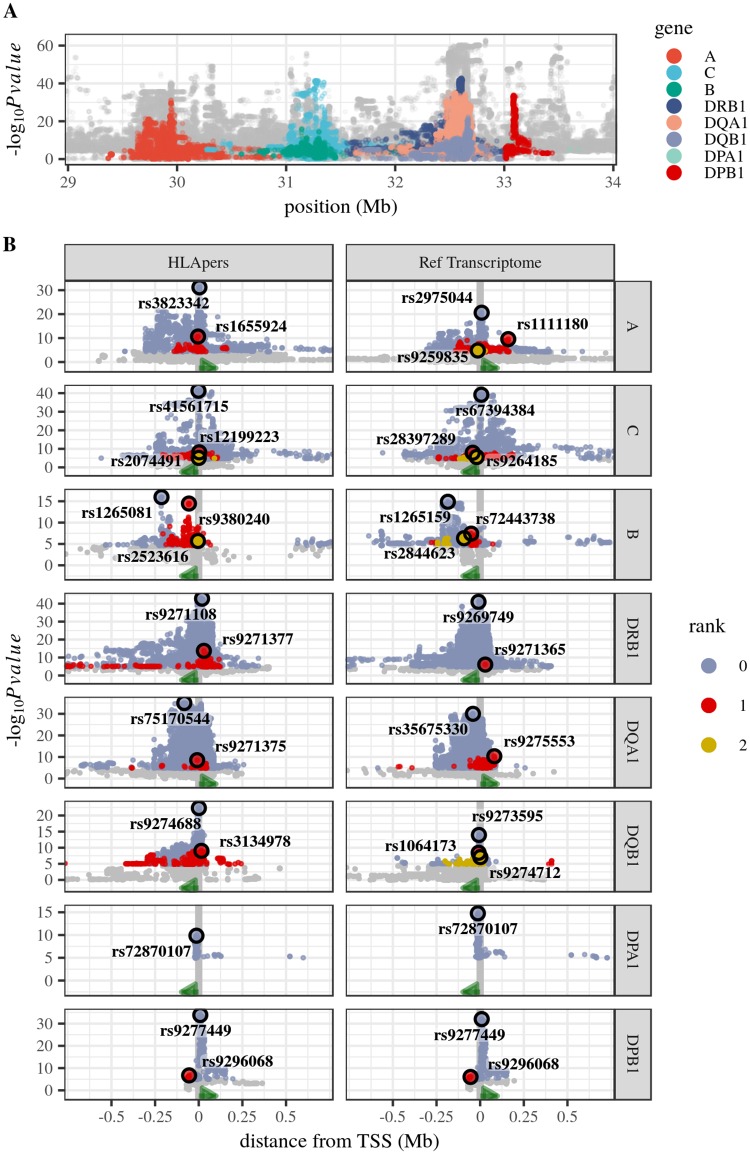
Fig 5. eQTLs for HLA loci.
A: Distribution of p-values for the association between genotypic and expression variation along the HLA region, colored by gene. B: Distribution of p-values around the transcription start site (TSS, vertical line at x = 0), for eQTLs mapped with HLApers or reference transcriptome pipelines. Points are colored according to the rank of association (with gray for non-significant associations at an FDR of 5%). The best eQTL of each rank is circled in black. Green arrows indicate the orientation of transcription. There was no eQTL mapped for HLA-DRA.

