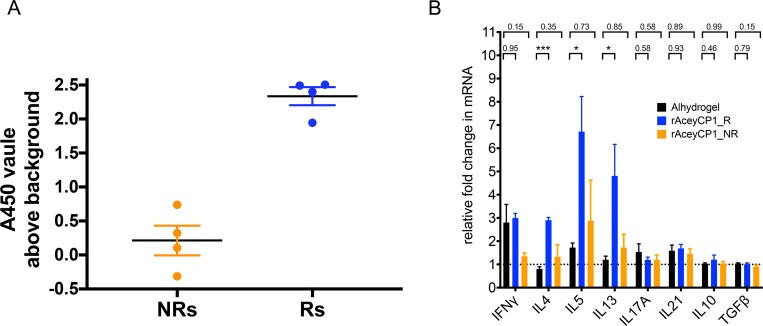
Fig 10. Assessment of rAceyCP1 splenic cytokine recall responses.
(A) Serum IgG ELISA for rAceyCP1/Alhydrogel vaccinates. Reported are the raw absorbances at 450 nm (A450) using 1:100 serum dilutions with background subtracted (average absorbance of Alhydrogel alone). Orange dots indicate rAceyCP1 serum IgG nonresponders (NRs). Blue dots indicate rAceyCP1 serum IgG responders (Rs). (B) qRT-PCR of cytokine mRNA transcripts in total RNA isolated from splenocytes collected from Alhydrogel controls (black bars; n = 5), rAceyCP1/Alhydrogel serum IgG responders (R) (blue bars; n = 4 see (A)), and rAceyCP1/Alhydrogel serum IgG nonresponders (NR) (orange bars; n = 4 see (A)). Splenocytes were stimulated with rAceyCP1 or PBS. Reported are the mRNA fold changes in rAceyCP1 relative to PBS stimulated. Data were normalized to actin. *** P = 0.0007; * P = 0.028 for IL5 Alhydrogel vs rAceyCP1_R, P = 0.015 for IL13 Alhydrogel vs rAceyCP1_R.

