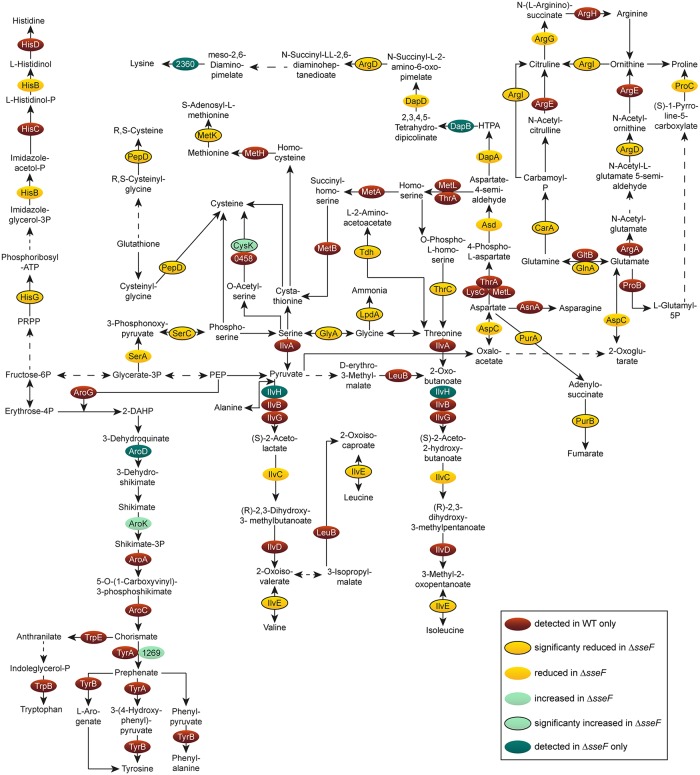
Fig 7. Amino acid metabolism of intracellular STM ΔsseF compared to WT.
Detected proteins were mapped against the pathways annotated as involved in the central amino acid metabolism of STM according to KEGG. The enzymes are presented in ovals; distinct colors indicate the abundance of the specific protein in STM ΔsseF compared to STM WT. Statistical analysis was performed as indicated for Fig 3.

