
Figure 2.
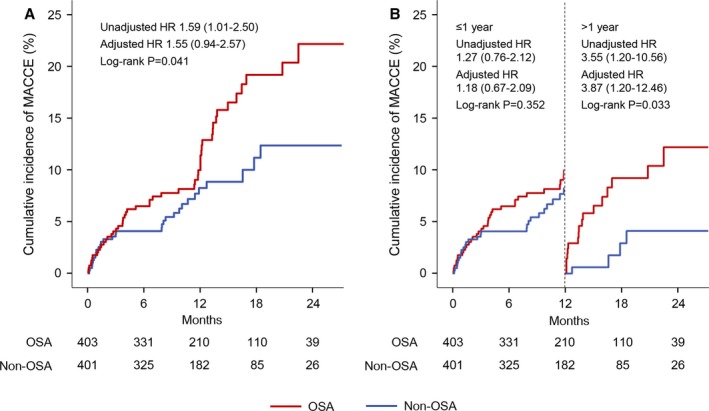
Kaplan–Meier curves for the overall and landmark analysis of MACCE. Cumulative incidences of MACCE are shown in the overall (A) and landmark (B) analysis, stratified on the basis of a cut‐off point at 1 year after sleep study (vertical dashed line). HRs for OSA vs non‐OSA groups were calculated separately for events that occurred within 1 year and those that occurred between 1 year and the end of follow‐up. HR indicates hazard ratio; MACCE, major adverse cardiovascular and cerebrovascular event; OSA, obstructive sleep apnea.