
Figure 3.
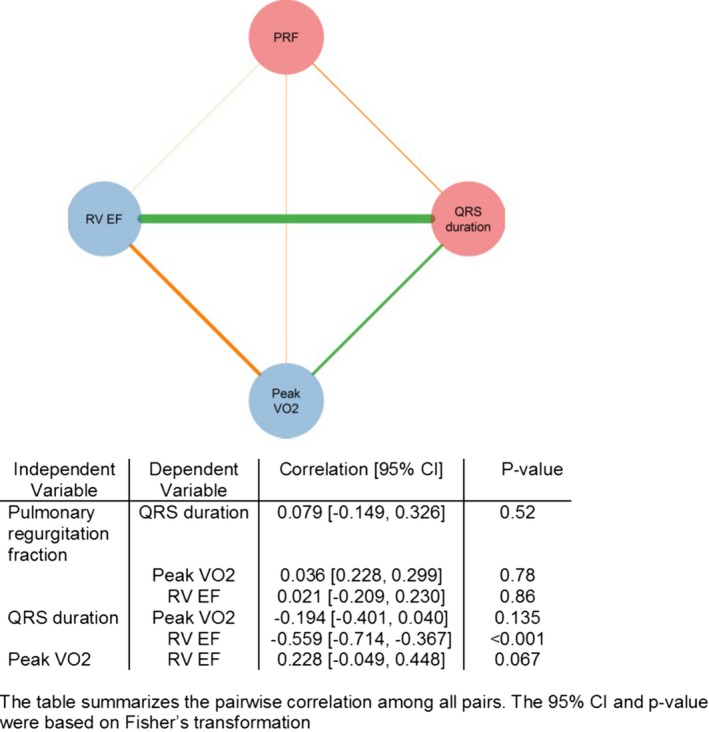
Univariable correlations of the outcome parameters in the clinical cohort. Circles and edges represented variables and pairwise Spearman's correlation, respectively. Red circles represent independent variables (ie, pulmonary regurgitation and QRS duration); blue circles represent the outcome variables. Orange edges show a positive correlation between 2 variables; green edges show a negative one. The thicker an edge is, the stronger the correlation is. RVEF indicates right ventricular ejection fraction; VO 2, oxygen consumption. PRF indicates pulmonary regurgitant fraction.