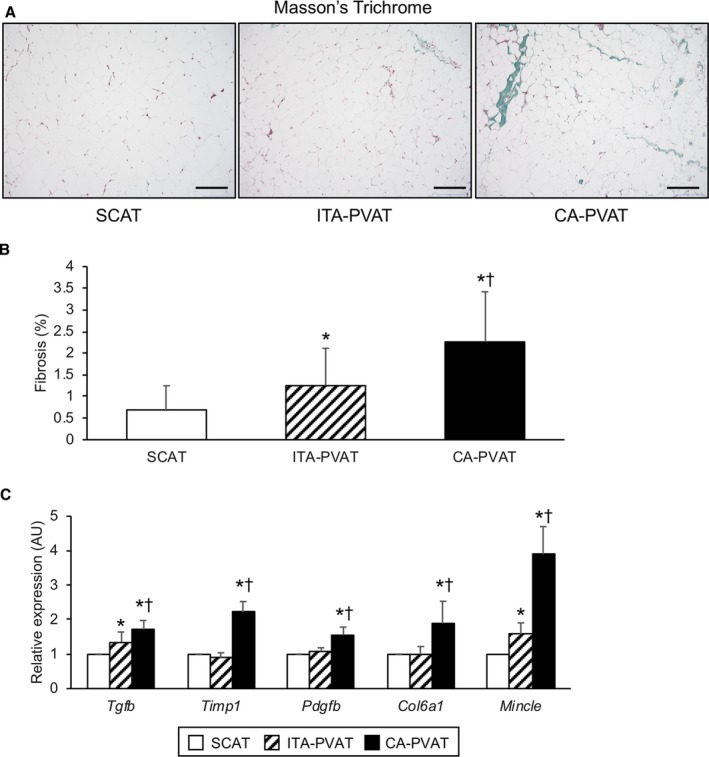
Figure 2.

Fibrosis in fat pads. A, Representative Masson's trichrome staining of subcutaneous adipose tissue (SCAT) and of perivascular adipose tissue surrounding the internal thoracic artery (ITA‐PVAT) and that surrounding the coronary artery (CA‐PVAT). Bar=200 μm. B, Fibrosis areas in SCAT, ITA‐PVAT, and CA‐PVAT (n=19 in each group). Results are shown as mean±SD. C, Gene expression levels of fibrosis‐related molecules, including transforming growth factor‐β (TGF‐β), tissue inhibitor of metalloproteinase 1 (TIMP1), platelet‐derived growth factor subunit B (PDGFB), collagen type 6 α 1 chain (COL6a1), and macrophage‐inducible C‐type lectin (MINCLE), in SCAT, ITA‐PVAT, and CA‐PVAT (n=27 in each group). Results are shown as relative expression of each target gene in SCAT of each patient and as mean±SEM. AU indicates arbitrary unit. *P<0.05 vs SCAT; † P<0.05 vs ITA‐PVAT.
