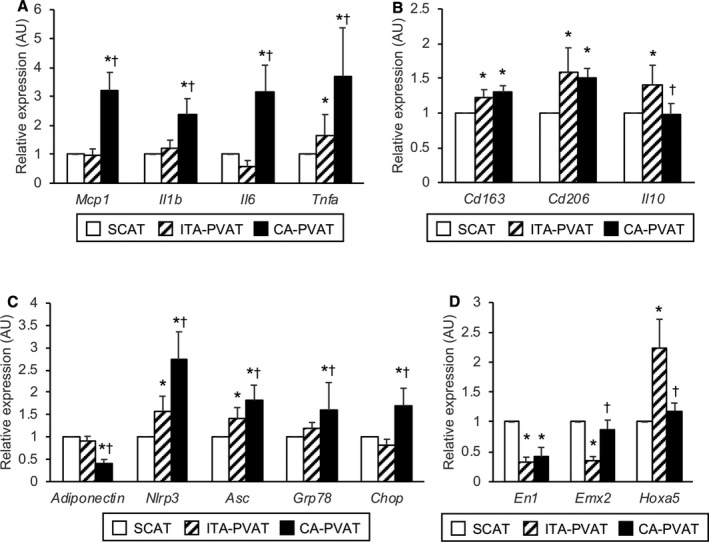
Figure 4.

Metaflammation and adipocyte developmental and pattern‐forming factors in fat pads. A, Gene expression levels of inflammatory molecules, including monocyte chemoattractant protein‐1 (MCP‐1), interleukin‐1β (IL‐1β), interleukin‐6 (IL‐6), and tumor necrosis factor‐α (TNFα), in subcutaneous adipose tissue (SCAT) and in perivascular adipose tissue surrounding the internal thoracic artery (ITA‐PVAT) and that surrounding the coronary artery (CA‐PVAT). B, Gene expression levels of M2‐polarized state‐related molecules, including CD163, CD206, and interleukin‐10 (IL‐10), in SCAT, ITA‐PVAT, and CA‐PVAT. C, Gene expression levels of adiponectin, inflammasome‐related molecules, including nucleotide‐binding domain, leucine‐rich–containing family, pyrin domain–containing‐3 (NLRP3) and apoptosis‐associated specklike protein containing caspase recruitment domain (ASC), and endoplasmic reticulum stress‐related molecules, including glucose‐regulated protein 78 (GRP78) and C/EBP homologous protein (CHOP), in SCAT, ITA‐PVAT, and CA‐PVAT. D, Gene expression levels of adipocyte developmental and pattern‐forming factors, including engrailed homeobox 1 (EN1), empty spiracles homeobox 2 (EMX2), and homeobox A5 (HOXA5), in SCAT, ITA‐PVAT, and CA‐PVAT (n=27 in each group). Results are shown as relative expression of each target gene in SCAT of each patient and as mean±SEM. AU indicates arbitrary unit. *P<0.05 vs SCAT; † P<0.05 vs ITA‐PVAT.
