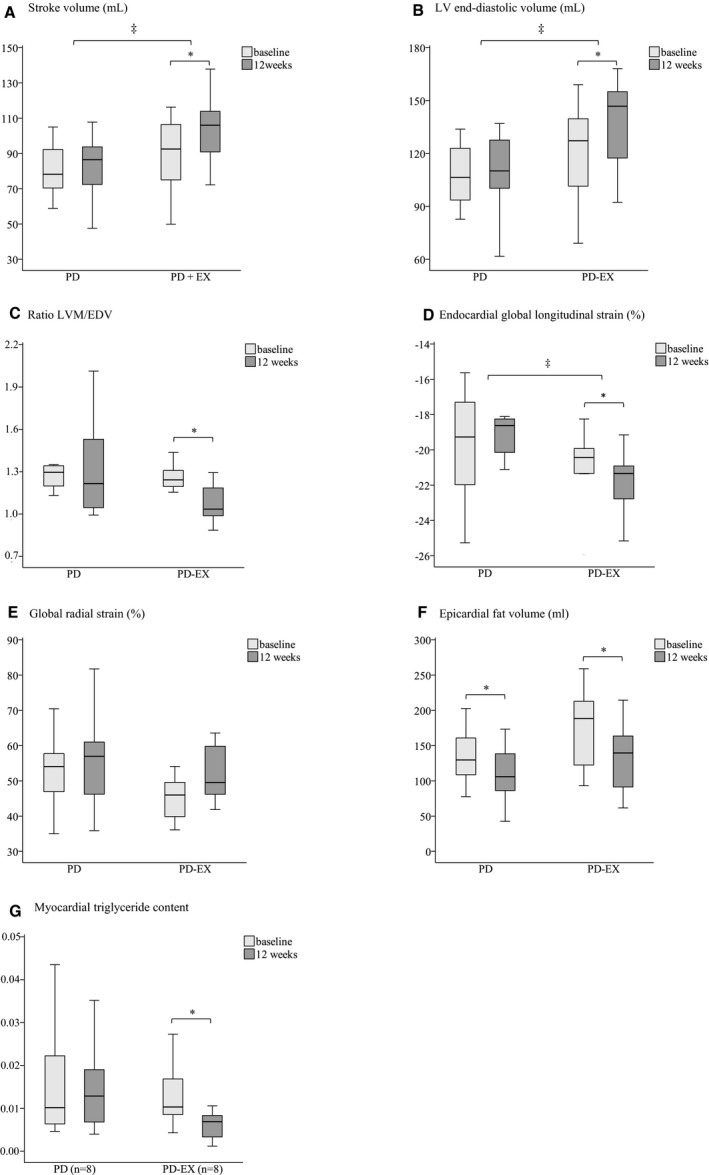
Figure 2.

Selected cardiovascular magnetic resonance and spectroscopy findings in participants during an intervention with a Paleolithic diet (PD) or a Paleolithic diet with additional supervised exercise training (PD‐EX) (A through G). The boxes represent medians and interquartile ranges, and whiskers represent the range of values, not including the outliers. LVM indicates left ventricle mass; EDV, end‐diastolic volume. The nonparametric Wilcoxon signed‐rank test was used to compare values within the groups. *P<0.05. The Mann–Whitney U test was used to compare changes between the 2 groups. ‡Significant differences in the changes between the groups (P<0.05).
