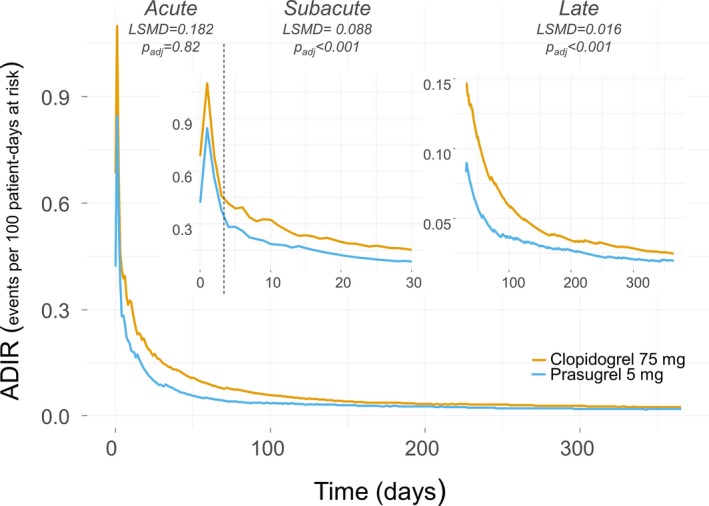
Figure 2.

Average daily ischemic rates (ADIRs) for prasugrel 5 mg (light blue line) vs clopidogrel 75 mg (orange line) daily. The lines plot the ADIR as a continuous variable in the time course of follow‐up. The main panel shows the overall follow‐up time, the upper small panels show (with ad hoc magnification) the first 30 d (upper left) including the acute and the subacute phases, which are separated by a dotted vertical line, and the 31 to 365 d of follow‐up (upper right). The least squares mean difference (LSMD) indicates, within each clinical phase, the absolute difference of ADIRs between study arms; for example, positive LSMD indicates more events occurring in patients receiving clopidogrel 75 than in patients receiving prasugrel 5 mg. The higher the LSMD, the greater the magnitude of effect.
