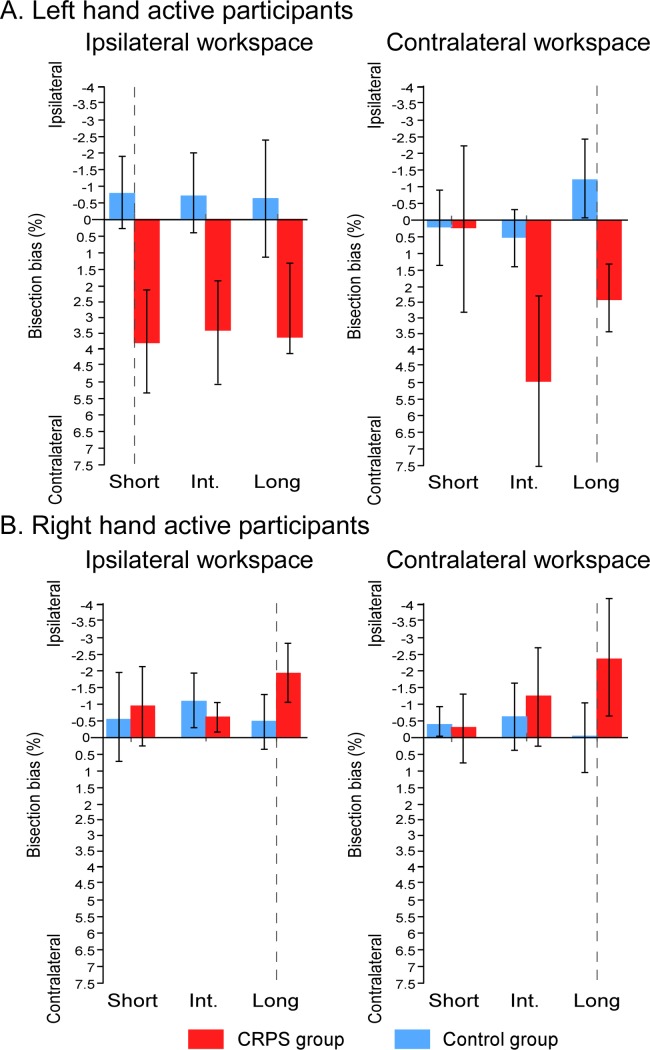
Fig 11. Mean bisection biases according to workspace, line distance and which hand is used.
The graphs illustrate the comparison of the bisection biases between the CRPS participants (red bars) and the control participants (blue bars) according to the workspace into which the task was performed (contralateral vs. ipsilateral to the static hand) and the distance of the lines (short vs. intermediate vs. long) and which is used (A: left hand; B: right hand), independently of the other variables. Direction of the bisection biases are coded relatively to the static hand, that is, the pathological hand in CRPS participants (i.e. ipsi- vs. contralateral). Vertical dash lines correspond to the vertical median of the semi-reflexive screen to which participant’s body midline was aligned. Error bars represent the 95% confidence intervals adapted according to the method of Cousineau [36].

