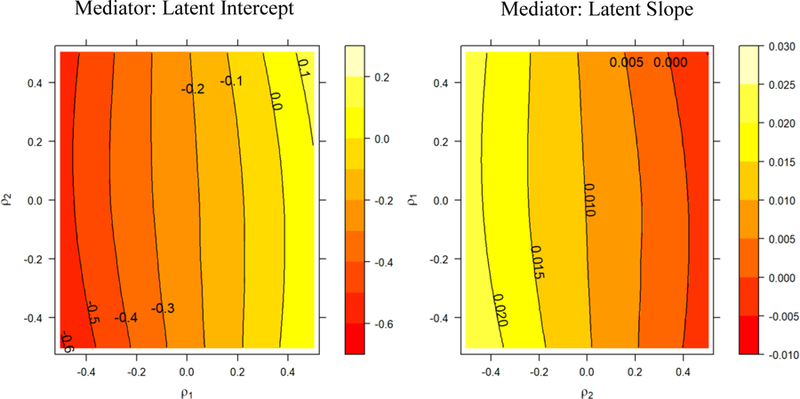
Figure 5.

Sensitivity contour plots for the indirect effects. Numbers adjacent to each contour line indicate indirect effect estimates. For the graph on the right, the independent variable, the mediator, and outcome variables are intervention, latent intercept, and heavy drinking as shown in Figure 4. For the graph on the left, the independent variable, the mediator, and outcome variables are intervention, latent slope, and drinking outcome. The confounder parameter ρ1 is the correlation between the residuals associated with the latent intercept and outcome variable and the confounder parameter ρ2 is the correlation between the residuals associated with latent slope and the outcome variable.
