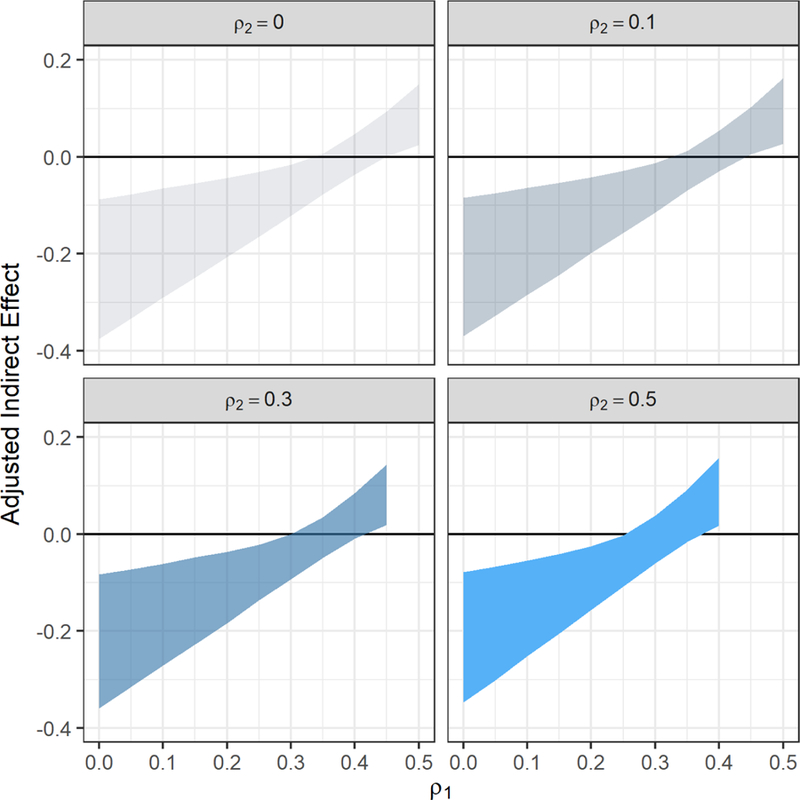
Figure 6.

Sensitivity confidence band graphs of 97.5% CIs for indirect effect through the mediator latent intercept. The x-axis on each panel graph shows the confounder parameter ρ1, which is the correlation between the residuals associated with the latent intercept and outcome variable for the correlated augmented model in Figure 4. The confounder parameter, ρ2, on top of each panel graph is the correlation between the residuals associated with latent slope and the outcome variable in Figure 4. The y-axis shows indirect effect estimate as a function of the confounder correlation parameters. The ribbon in each graph shows the 97.5% CI bands.
