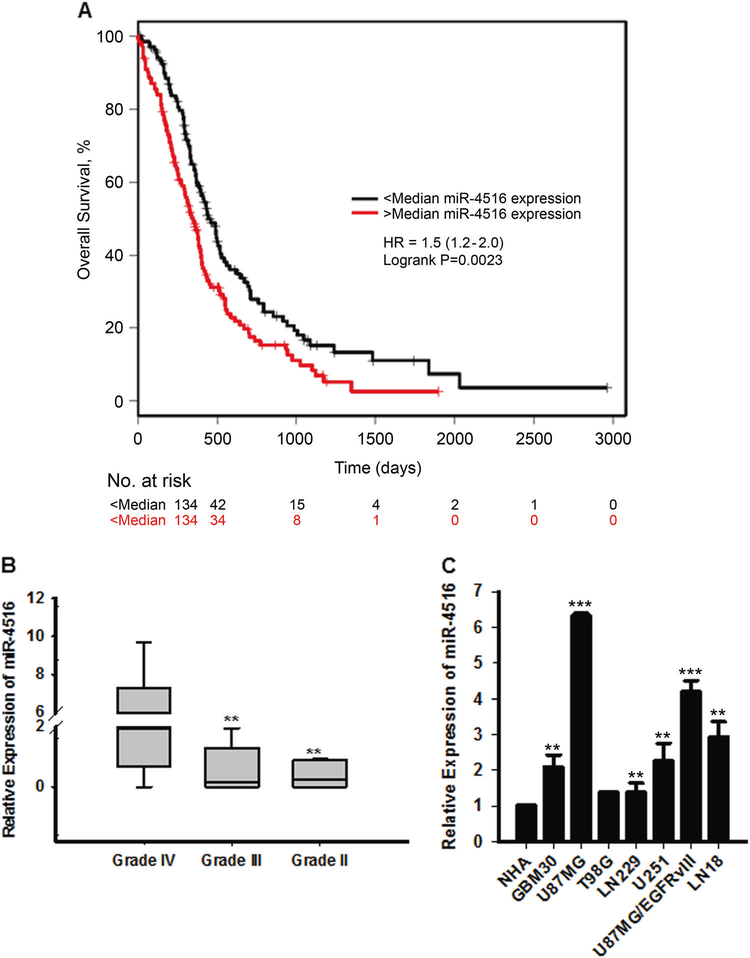
Figure 1. Expression of miR-4516 in glioma patient samples and cell lines.
(A) Correlation between miR-4516 expression and OS by Kaplan-Meier analysis of GBM patients with high (n=134) and low (n=134) expression of miR-4516. (B) qRT-PCR analysis of miR-4516 expression in grade II (n=8), grade III (n=8), and grade IV (n=8) glioma patient samples by qRT-PCR. Normalized by miR-361–5p. Alterations in miR-4516 expression are shown as box plot. **P<0.01. (C) Expression of miR-4516 in 7 glioblastoma cell lines (GBM30, U87MG, T98G, LN229, U251, U87MGvIII, and LN18) and NHA. Normalized by miR-361–5p. n=3, **P<0.01, ***P<0.001.

