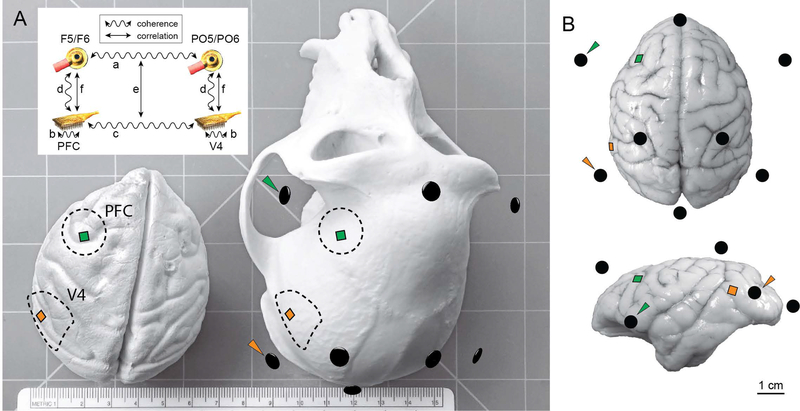
Figure 1.
Schematic of electrode arrays and EEG electrodes. A) Model of a rhesus macaque brain (left) and skull (right). Dotted lines indicate craniotomy locations for Monkey W (other subjects had craniotomies on their right sides). Squares represent electrode arrays in PFC and V4. Black ellipsoids correspond to EEG electrode locations from a representative session co-registered in three-dimensional space with anatomical landmarks on the skull, and arrowheads indicate EEG electrodes used in the coherence analysis. The ruler on the bench shows scale in centimeters (15.3 cm across). Inset depicts the analysis strategy. First, we analyzed coherence between EEG electrodes (a). Next, we analyzed coherence between LFPs both within (b) and between (c) arrays. We then analyzed coherence between the LFP arrays and the nearby EEG electrodes (d). Our key analysis was to measure trial-to-trial correlation between coherence estimates at the two measurement scales (e). We also measured trial-to-trial correlations of oscillatory amplitudes between measurement scales (f). B) Dorsal (top) and lateral (bottom) views of a rhesus brain superimposed with electrode locations. The brain depicted was not from a subject of this study and is only for illustration purposes; the array icons are positioned according to anatomical landmarks, which vary between individual animals.

