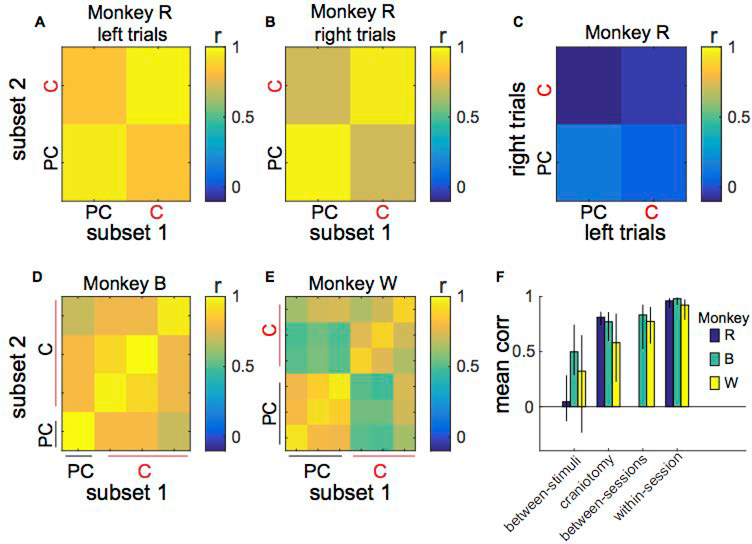
Figure 10.
Pre-craniotomy (PC) and craniotomy (C) VEPs are more correlated than left and right stimulus VEPs. A-B) Subset 1 versus subset 2 correlations for Monkey R’s left (L) and right (R) stimulus VEPs. Subset 1 and 2 are partitions of the entire set of VEP trials for a particular session and stimulus. Each square is the correlation across the P1 component using all eight electrodes between all combinations of trial subsets for the same stimulus. VEPs from the same session are strongly correlated (r > 0.95). VEPs from pre-craniotomy and craniotomy sessions are only slightly less correlated (r ≈ 0.80). C) Opposite hemifield stimuli VEP correlations for Monkey R. Each square depicts the correlation between the left and right stimulus VEPs from all combinations of trial subsets for the same stimulus. VEPs to opposite hemifield stimuli are relatively weakly correlated (r < 0.22). D-E) Subset 1 versus subset 2 correlations for Monkey B and W (VEP correlations for left hemifield stimuli averaged with VEP correlations for right hemifield stimuli). F) Mean of correlations for different sources of variability (between-stimuli, craniotomy, between sessions, within-session) for all subjects (Monkeys R, B and W). We applied Fisher’s r-to-z transformation to correlation coefficients prior to averaging, then inverse-transformed the resultant averages for presentation. Error bars indicate the 95% bootstrapped confidence intervals. A between-sessions comparison was not available for Monkey R.

