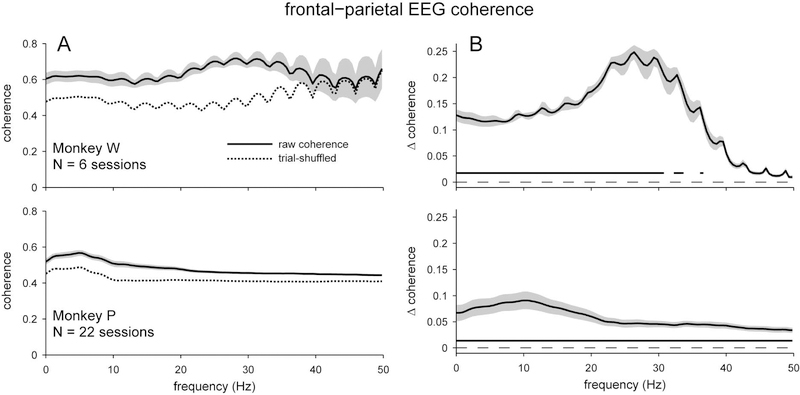
Figure 2.
Coherence between frontal and parietal scalp EEG electrodes during visual change-detection task. A) Overall coherence (solid), and the average coherence when trial order was shuffled (dashed). B) Excess coherence (Δ coherence) when the trial-shuffled value was subtracted from the overall coherence. Both subjects had significant excess coherence, particularly at frequencies < 30 Hz. Shading represents ± 1 SEM. Underlining represents frequencies with significant, Bonferroni-corrected, one-sample t-test results at α = 0.05.

