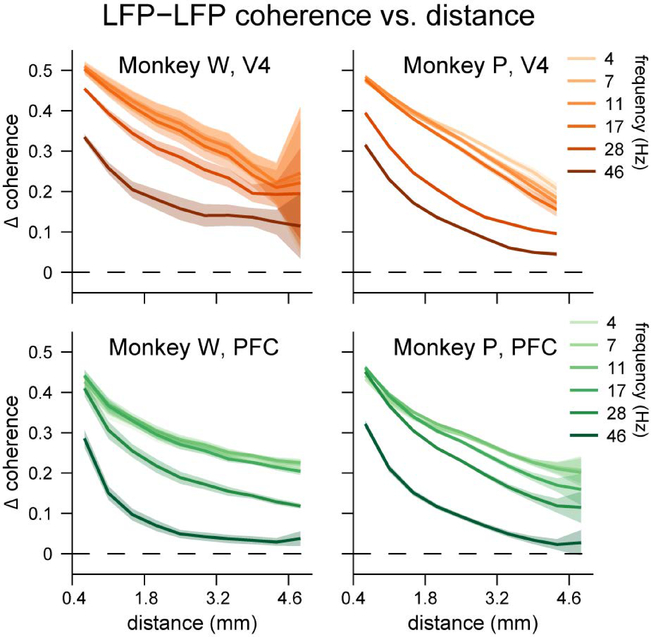
Figure 3.
Excess coherence (Δ coherence) between electrodes within a brain area. A-B) Excess coherence between electrodes in V4. C-D) Excess coherence between electrodes in PFC. For both brain areas we binned pairs of electrodes based on the distance between them, and averaged coherence values within each distance bin. Excess coherence within each brain area was greatest at low frequencies and at close proximity, and decreased with increasing frequency or distance. Shading represents ± 1 SEM.

