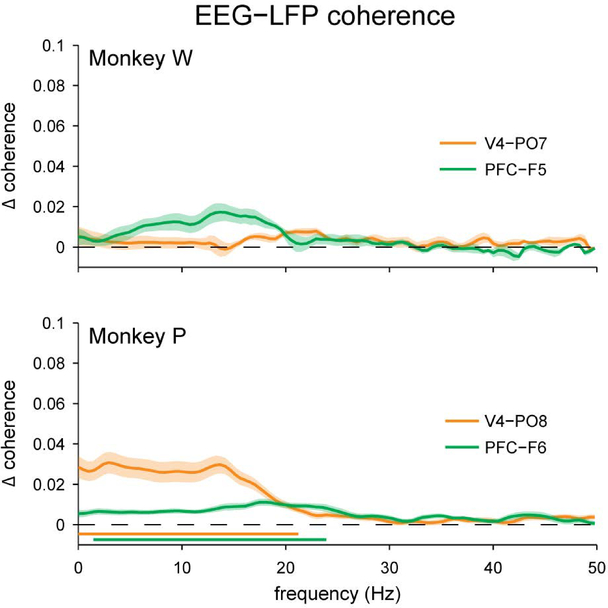
Figure 5.
Excess coherence (Δ coherence) between local field potentials measured intracranially and EEG signals measured nearby at the scalp. For both subjects, there was little excess coherence between local field potentials and nearby scalp EEG, especially when compared to the magnitude of coherence between EEG electrodes (Figure 2). For Monkey P, significant excess coherence was found at frequencies below 24 Hz, whereas no significant coherence was found for Monkey W. Shading represents ± 1 SEM. Underlining represents frequencies with significant, Bonferroni-corrected, one-sample t-test results at α = 0.05.

