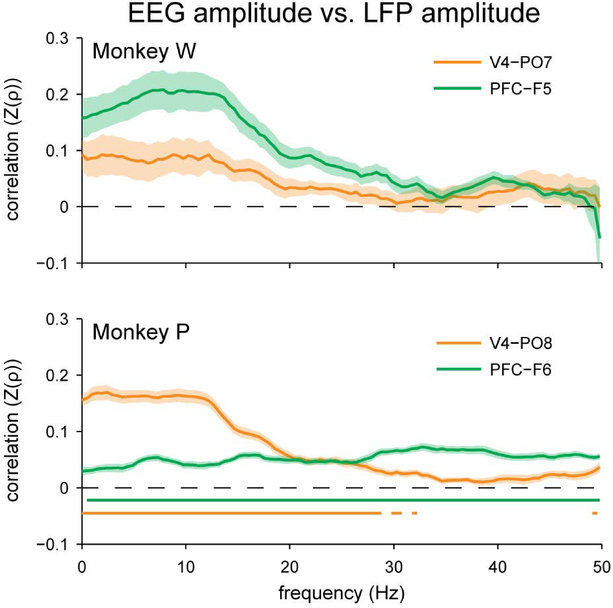
Figure 7.
Spearman’s rank correlation between EEG amplitude measured at the scalp and local field potential amplitude measured intracranially. Compared to the results for coherence (Figures 4 and 5), there was a stronger trial-to-trial relationship between the amplitude of local field potential oscillations and the amplitude of nearby EEG oscillations, particularly at low frequencies. This relationship was significant for Monkey P, but did not survive Bonferroni correction for Monkey W. Fisher’s r-to-z transformation was applied to the correlation coefficients prior to averaging, signified as “Z(ρ)”. Shading represents ± 1 SEM. Underlining represents frequencies with significant, Bonferroni-corrected, one-sample t-test results at α = 0.05.

