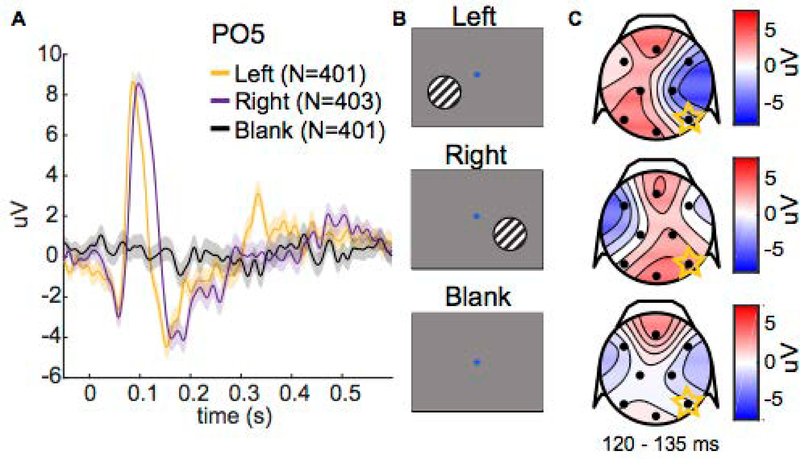
Figure 8.
Visual-evoked potentials (VEPs). A) VEPs for one subject (Monkey B) on the PO5 electrode for different stimulus conditions. Stimulus onset occurs at 0 s. Shading represents ± 1 SEM (total number of trials per condition is noted in the legend). B) Depictions of different stimuli in the passive visual stimulation task. The subject fixated on the central dot, then a sinusoidal grating appeared on one side of the screen at 0 s (left/right condition), or no grating appeared (blank condition). The grating remained on for 600 ms. C) Topographical scalp voltage maps from 120 to 135 ms. Black dots show the approximate location of EEG electrodes.

