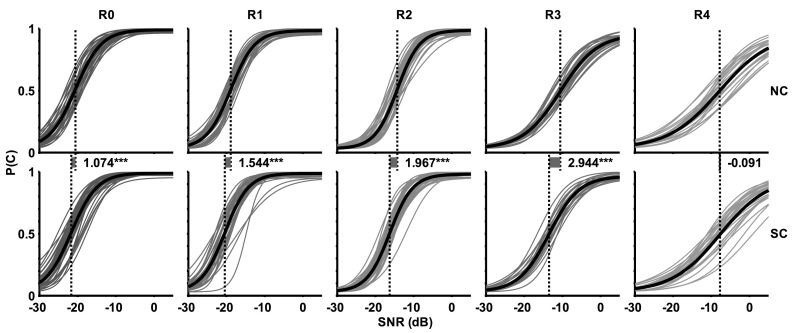
FIG. 6.
(Color online) Fitted psychometric functions for individual subjects in both NC (top row) and SC (bottom row) conditions as a function of simulated sound field (R0–R4). For each set of functions, the bold curve represents the average, computed by evaluating the logistic function with mean parameter estimates for the set, and the dashed vertical line indicates the mean threshold parameter. Differences (in dB) between the mean NC and SC thresholds are also indicated for each sound field. “***” indicates p < 0.001.

