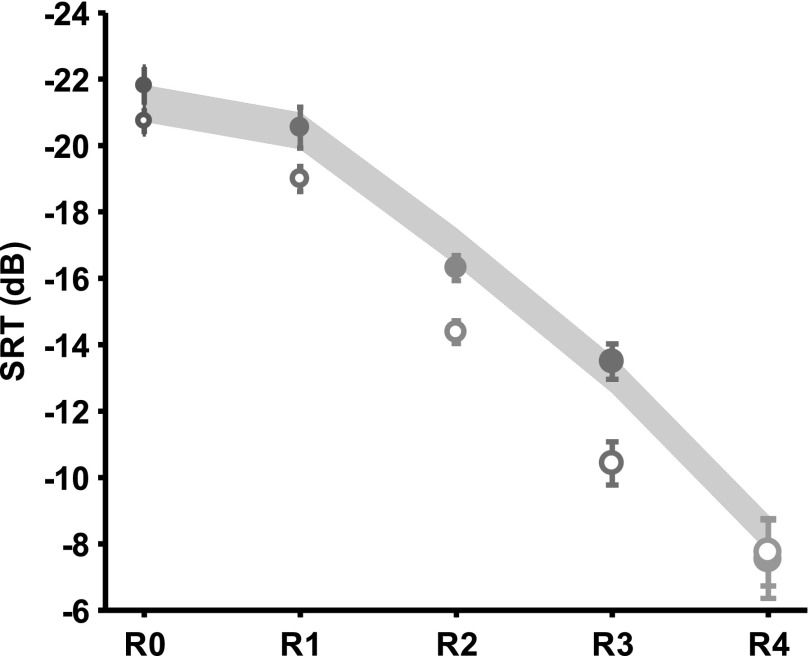
FIG. 8.
(Color online) Mean SRT corresponding to 50% correct as a function of simulated room. Bars indicate 95% confidence intervals. Solid symbols are means from the SC condition and open symbols are means from the NC condition. The shaded region represents the estimated SRT based on the STI using R0 SRTs in the NC and SC conditions as anchor points. See the text for details.

