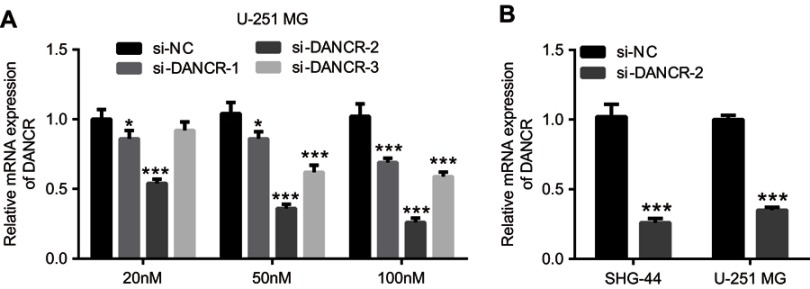
Figure 2.
Endogenous expression levels of differentiation antagonizing nonprotein coding RNA (DANCR) in glioma cells.
Notes: U-251 MG cells transfected with different concentrations (20 nM, 50 nM, and 100 nM) of negative control (si-NC), si-DANCR-1, si-DANCR-2, and si-DANCR-3 were examined by quantitative reverse transcription PCR (qRT-PCR) analysis (A). Subsequently, expression levels of DANCR in U251MG and SHG-44 cells transfected with si-DANCR-2 were analyzed by qRT-PCR (B). Data are shown as the mean ± SD. ***P<0.001 vs si-NC.

