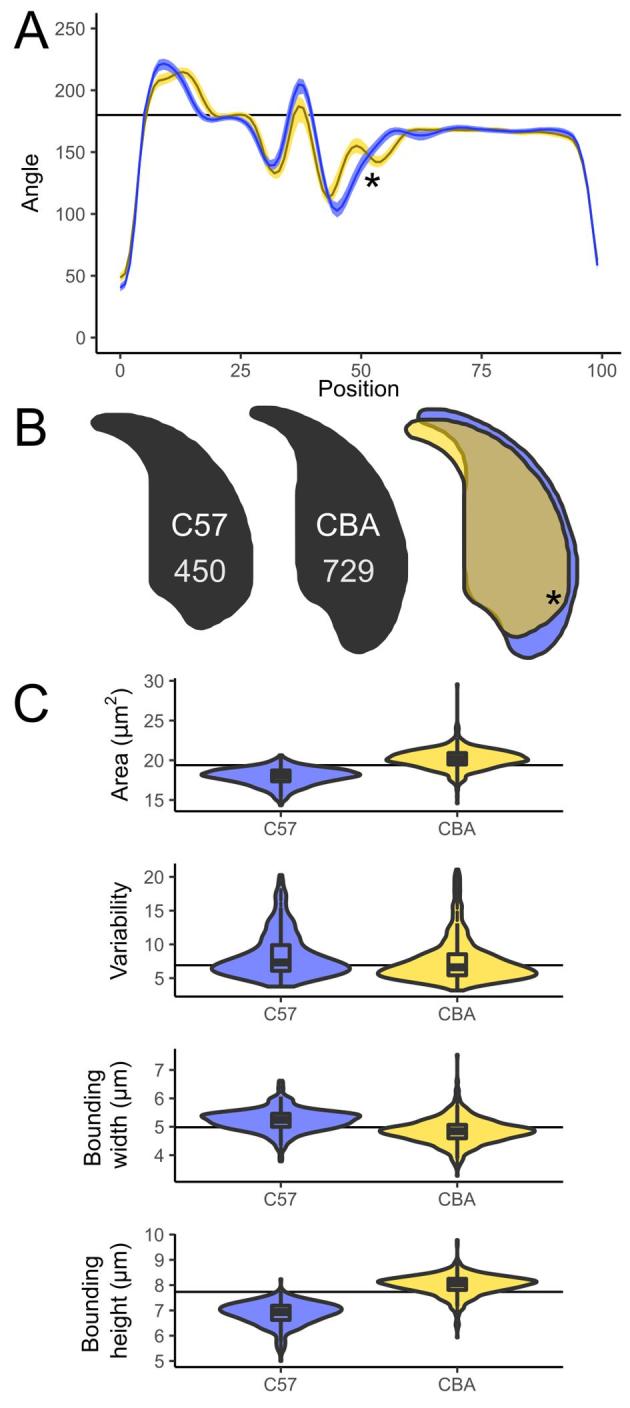
Figure 2.

(A) Comparison of angle profiles between C57Bl6 (yellow) and CBA (blue), showing the median and interquartile range of the nuclear angle profiles. (B) Consensus nuclei from each population, and the overlap showing the regions differing. (C) Size and shape measurements between the strains; sperm numbers are shown on the consensus nuclei. The prominent dorsal angle in C57Bl6 nuclei is marked with an asterisk.
