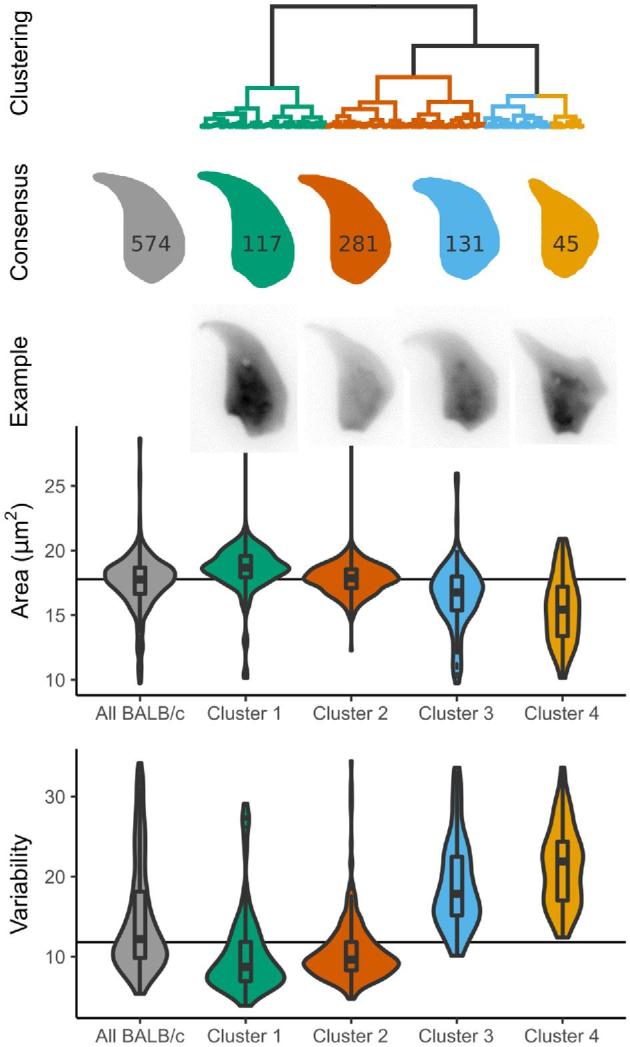
Figure 5.

Clustering of BALB/c sperm reveals sub-populations of nuclei. Compared to the overall population of BALB/c sperm (grey), nuclei with distinct shapes are revealed, from mostly normal (green) to highly abnormal (yellow). The number of sperm in each cluster is given on the consensus shape. Sperm from each of the two animals are equally represented in each cluster (Supplementary Table S7).
