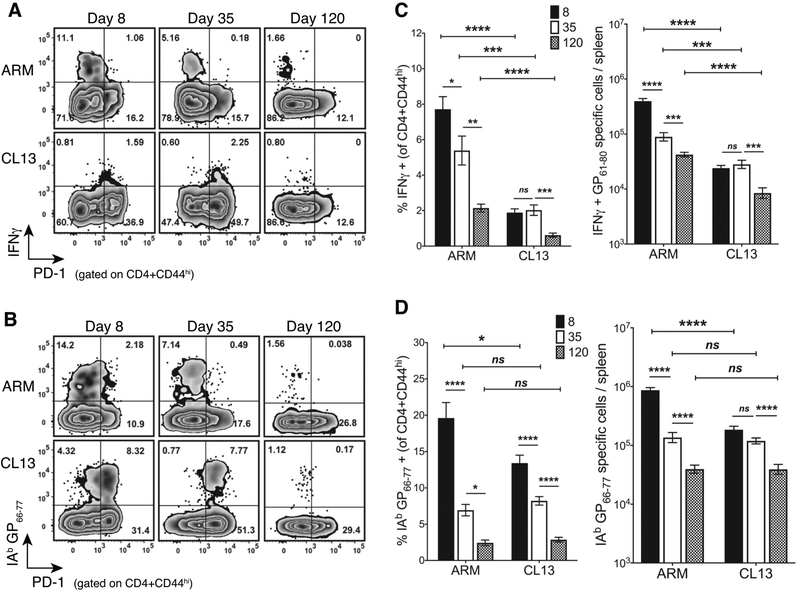
Figure 1. Chronic antigen stimulation leads to T cell dysfunction but maintains tetramer positive cells at a number comparable to the acute response.
(A) A representative flow plot with the frequency of IFNγ and PD-1 expressing cells in ARM and CL13 at the indicated days post infection (dpi) gated on CD4+CD44hi splenocytes. (B) A representative flow plot with the frequency of IAb GP66–77 tetramer+ and PD-1 expressing cells under the conditions mentioned in (A). (C) Frequency (left) and log transformed absolute numbers (right) of IFNγ producing cells at the time points and infections represented in the flow plot in (A). (D) Frequency (left) and log transformed absolute numbers (right) of IAb GP66–77 tetramer+ T cells represented in (B). (C,D) Cumulative data with 3–5 independent experiments and a total n = 7–19 mice/group at n=2–5 mice/experiment/group. Bar graphs with Mean ± SEM. Statistical significance, ns = no significance, * P > 0.05, ** P > 0.01, *** P > 0.001, **** P > 0.0001, Student t-test (ARM vs CL13), Ordinary one-way ANOVA Tukey’s multiple comparison test (between dpi - individual infections).

