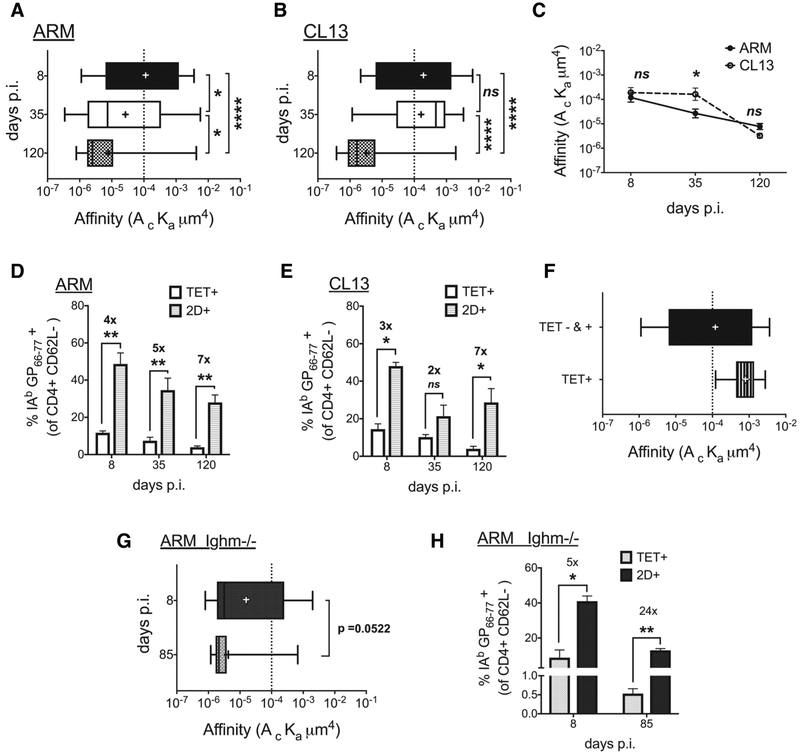
Figure 2. CD4 T cell affinity peaks at effector phase and declines equally with memory in acute and chronic infection.
(A, B) 2D affinity of IAb GP66–77 specific cells in CD4+CD62L- enriched samples from ARM (A) and CL13 (B) infected splenocytes and a comparison of the two infections (C) at the designated days. (D,E) A comparison of tetramer and 2D detected frequency of IAb GP66–77 specific cells in above-mentioned samples from (D) ARM and (E) CL13. (F) 2D affinity of sorted tetramer+ and total (tet+ and tet-) CD4+CD62L- cells from d7 ARM infected splenocytes. (G) 2D affinity of IAb GP66–77 specific CD4+CD62L- T cells from ARM infected B-cell deficient (Ighm−/−) mice at d8 and d85 dpi with p-value (0.0522). (H) Comparison of tetramer and 2D frequency in samples from (G). All data representative of 2–3 independent experiments with splenocytes from 2–3 mice pooled pre-CD4+CD62L- enrichment per time point and per infection. Affinity data log transformed with (+) sign depicting mean affinity in box and whisker graphs with min to max range of measured single cell affinities. Tetramer + high affinity cell cutoff as a dotted line at 1 × 10⁻⁴. Mean + SEM in bar graphs. Statistical significance, ns = no significance, * P > 0.05, ** P > 0.01, *** P > 0.001, **** P > 0.0001, (A,B) Ordinary one-way ANOVA Tukey’s multiple comparison test, (C) Sidak’s multiple comparison test, (D, E, G, H) Student t-test.

