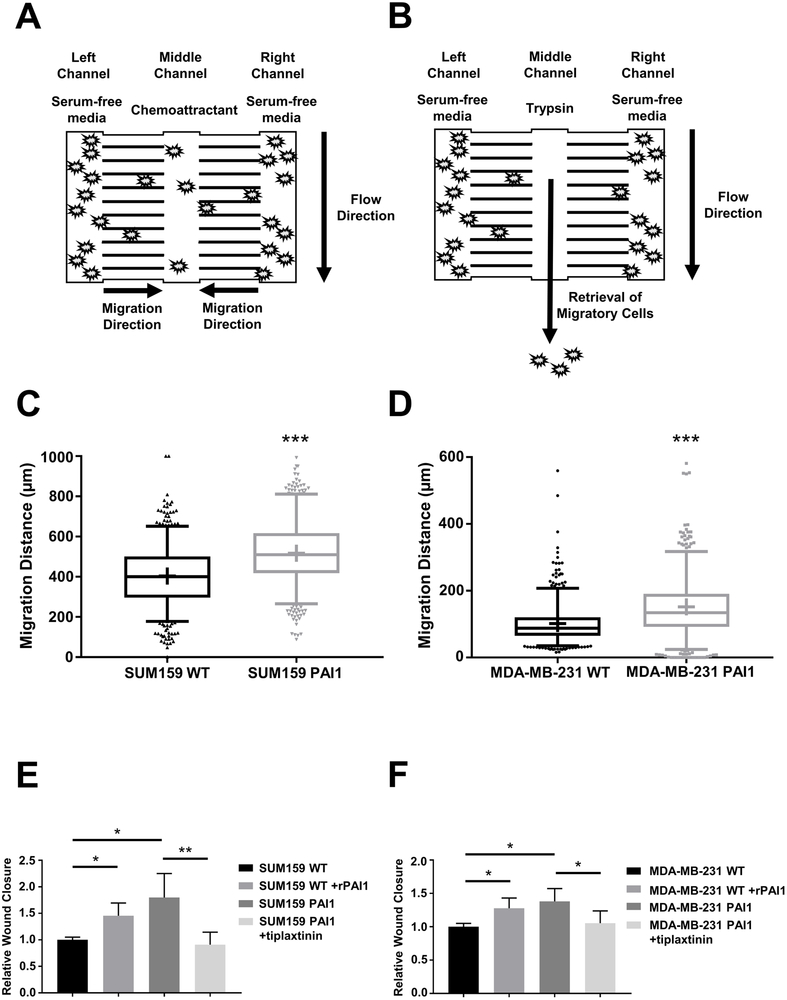
Figure 1. PAI1 enhances migration of TNBC cells.
A. Schematic of the migration device. We initially loaded cells into the left and right chambers of the device in serum-free media. After cells adhered, we loaded media containing a chemoattractant (serum) into the middle channel to stimulate migration for 24 hours. B. We used trypsin to selectively recover cells from the middle channel for further analyses. C, D. Graphs show box and whisker plot summaries (top) and frequency distributions (bottom) for migration of SUM159 (C) and MDA-MB-231 (D) WT and PAI1 cells toward serum in the device (n = 600 cells per group). *** = p < 0.0001. E, F. Summary of percentages of wound closure presented as mean + SD (n = 9). * = p < 0.05, ** = p < 0.01, as compared with WT control cells.

