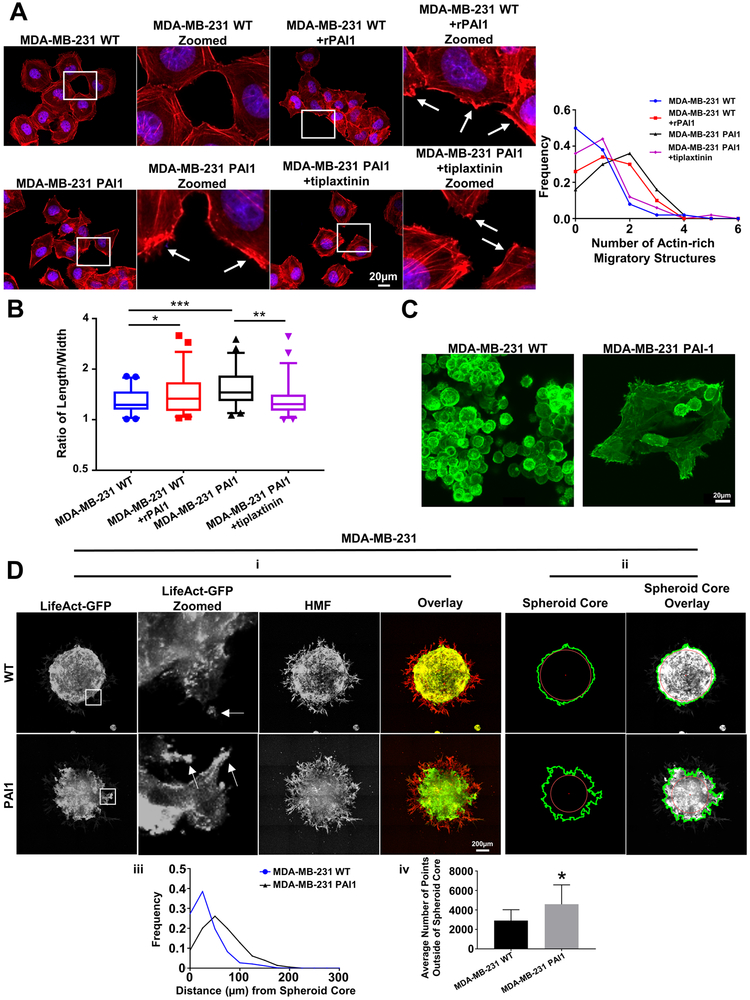
Figure 3. Stable expression of PAI1 promotes actin cytoskeletal reorganization and a more invasive phenotype in MDA-MB-231 TNBC cells.
A. Left. Representative overlaid images of immunofluorescence staining of phalloidin (red) and nuclear DAPI (blue) of WT cells; WT cells treated with rPAI1 (40 nM); PAI1 cells; and PAI1 cells treated with tiplaxtinin (5 µM). Arrows point to actin-rich migratory structures. Right. Frequency distribution of number of actin-rich migratory structures per cell for each group (n = 50 cells). B. Box plot and whiskers for the aspect ratio (length/width) of cells in each group demonstrates more elongated morphology of PAI1 cells (n = 50 cells). * = p < 0.05. ** = p < 0.01. *** = p < 0.0001. C. Representative images of spheres formed from single cells of MDA-MB-231 WT and PAI1 cells that express LifeAct-GFP. D. i. Representative images of spheroids composed of MDA-MB-231 WT or PAI1 cells that express LifeAct-GFP (green) and human mammary fibroblasts (HMFs, red). Arrows in zoomed picture point to actin-rich migratory structures. ii. Example images that define the perimeter of cancer cells in a spheroid (green line), the center of the spheroid (red dot), and the spheroid core (red circle) as defined in Figure 2. iii. Frequency distribution of the distance of points on the perimeter of the spheroid from the spheroid core (n ≥ 9 spheroids). iv. Graph showing the mean number of points on the perimeter + SD that fall outside of the spheroid core (n ≥ 9 spheroids). * = p < 0.05.

