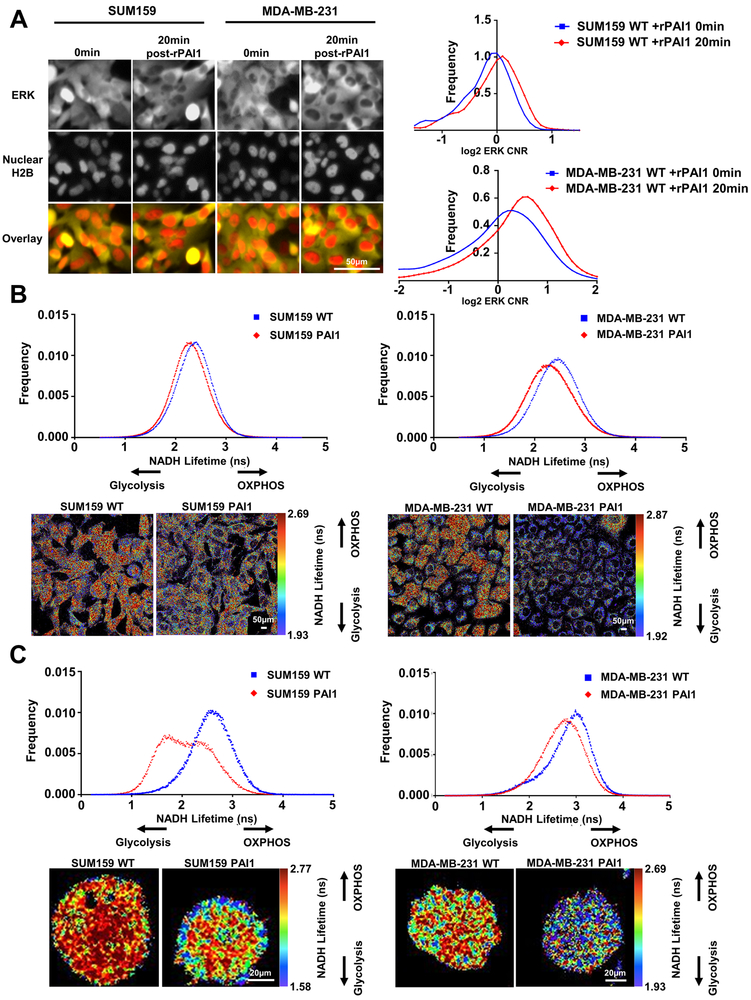
Figure 4. PAI1 activates ERK signaling and promotes glycolytic metabolism in TNBC cells.
A. Left. Representative fluorescence images of ERK KTR (yellow) and nuclear H2B-mCherry (red) in SUM159 and MDA-MB-231 WT cells at the initial timepoint (0 min) and 20 minutes after addition of rPAI1 (40 nM) showing translocation of yellow fluorescence out of the nucleus (darker nucleus, ERK activation). Right. Frequency distribution of cytoplasmic-to-nuclear ratio (CNR) of SUM159 (n > 350 cells) and MDA-MB-231 (n > 670 cells) WT cells at the initial timepoint (0 mins) and 20 minutes after addition of rPAI1 (n = 2). A shift to the right demonstrates activation of ERK signaling. B. Frequency distributions for NADH lifetime and representative FLIM images of SUM159 and MDA-MB-231 WT and PAI1 cells in 2D (B, SUM159: n ≥ 12, and MDA-MB-231: n ≥ 9) and in 3D fibrin gels (C, SUM159: n ≥ 39, and MDA-MB-231: n ≥ 36). Both SUM159 and MDA-MB-231 PAI1 cells shift toward glycolytic metabolism as defined by a shorter NADH lifetime in 2D and 3D environments.

