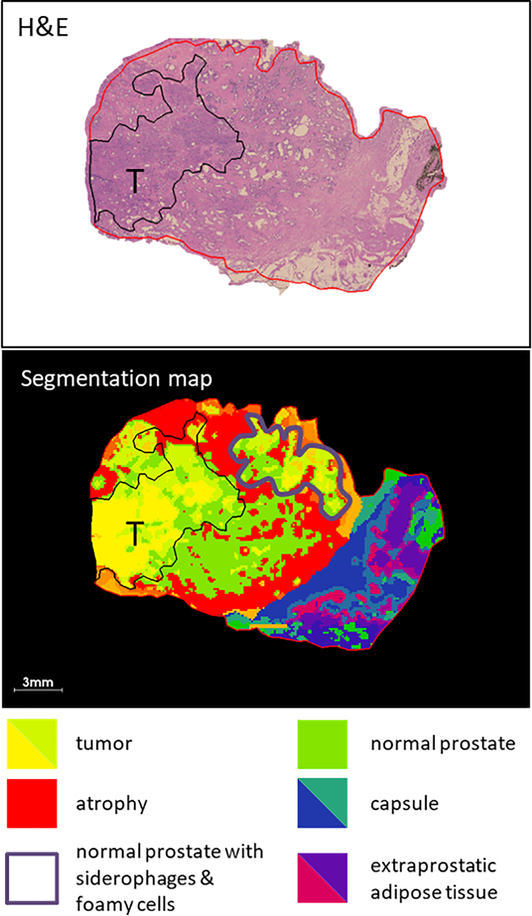
Fig. 1.
Comparison of histopathology and segmentation map produced by clustering of MALDI MSI data (k=16) from a section of prostate tissue with Gleason score 9. The tumor region is delineated in black, different colored clusters correlate with different histopathological features in the tissue, as indicated by the key inset.

