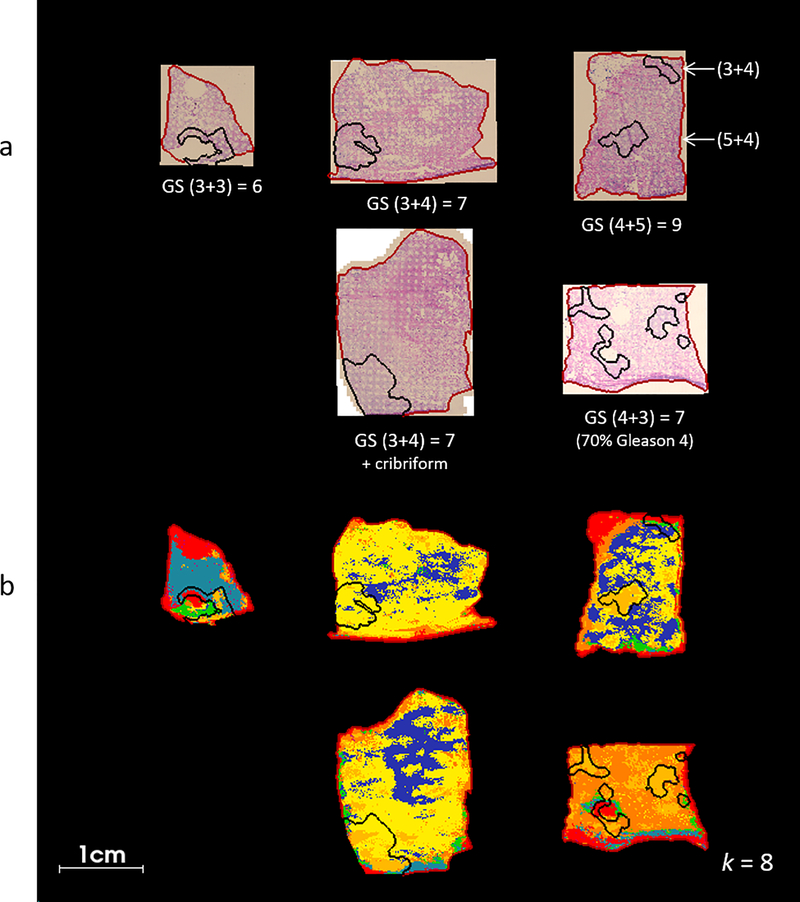
Fig. 3.
H&E and segmented MALDI FT ICR MS images of prostate cancer tissue, a) H&E images of tissue post-MALDI MS imaging, Gleason score (GS) is indicated inset and tumor regions as determined by histopathological evaluation are marked in black, the tissue boundary (marking the area selected for MALDI MSI) is marked in red, b) segmentation maps produced via bisecting k-means clustering (k = 8) of MALDI MSI data, tumor regions were transferred from registered H&E images.

